Innomesh v3.4.1
Released to production on 24/05/2024.
Portal Features
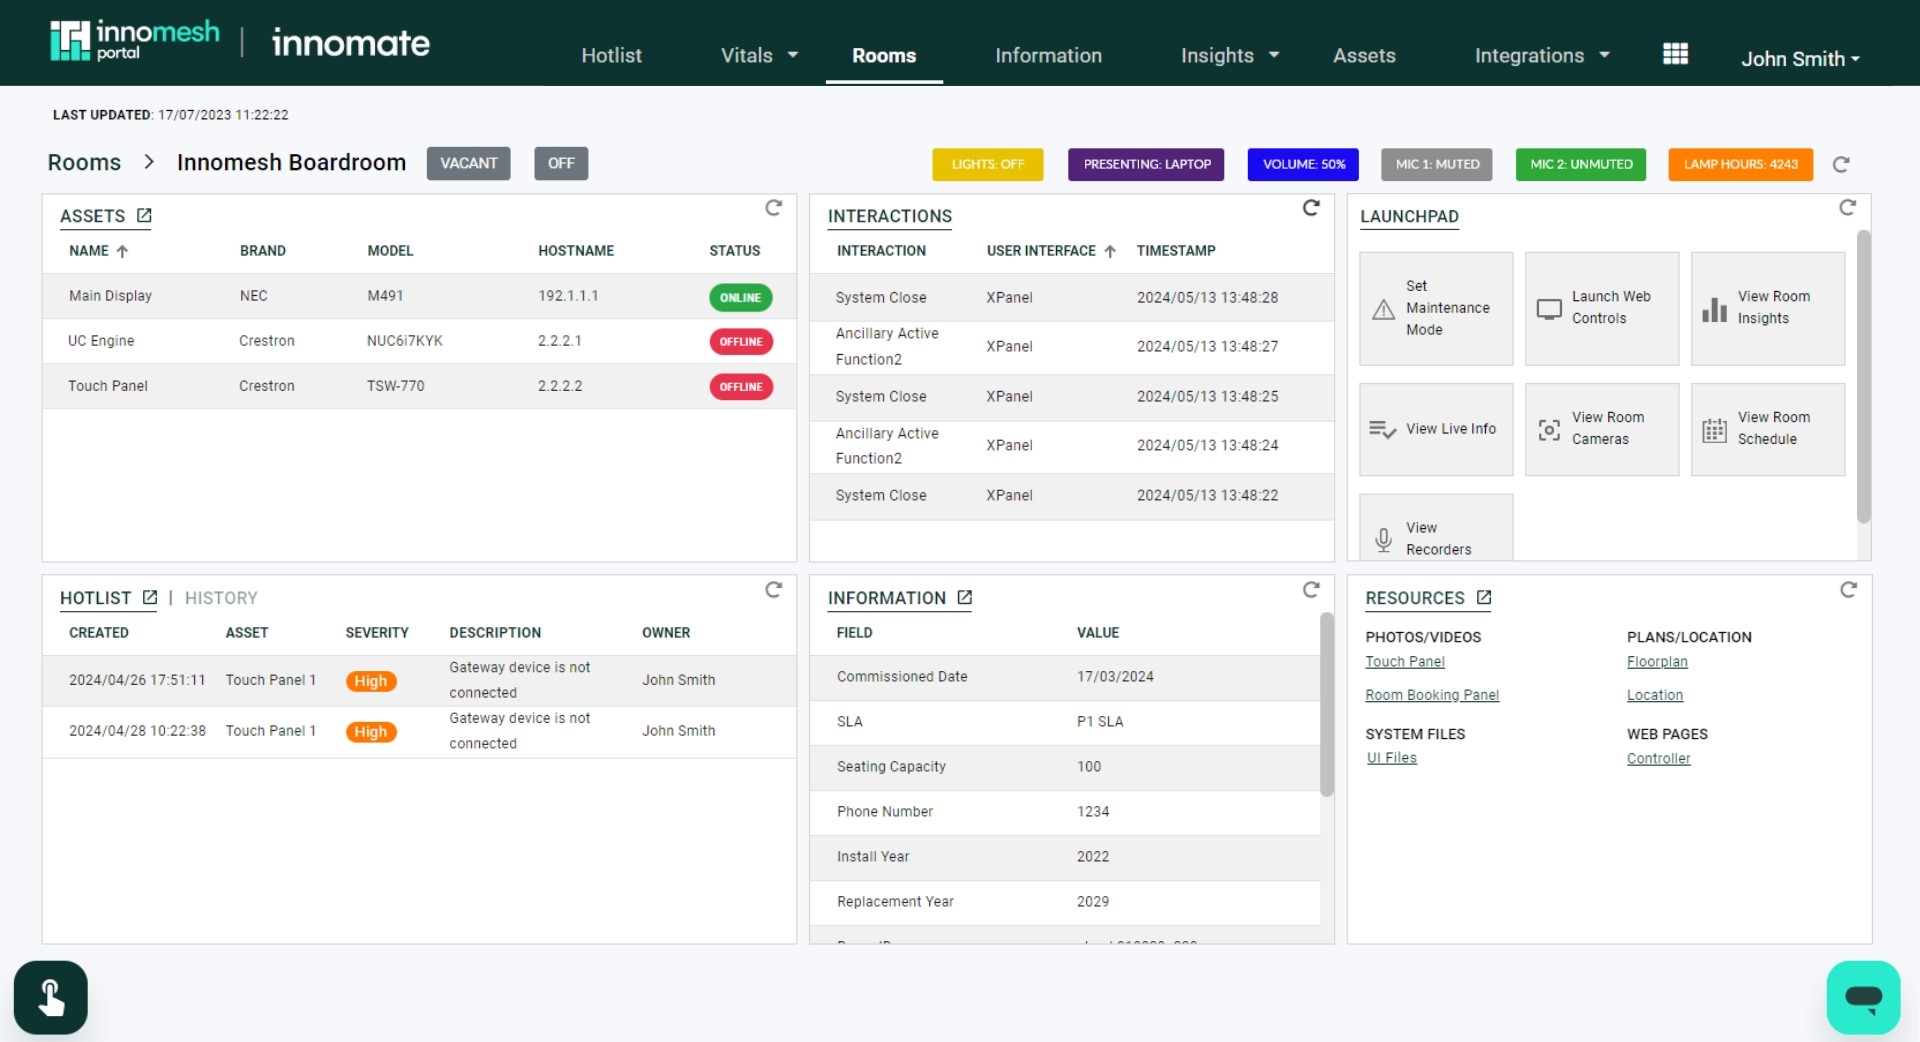
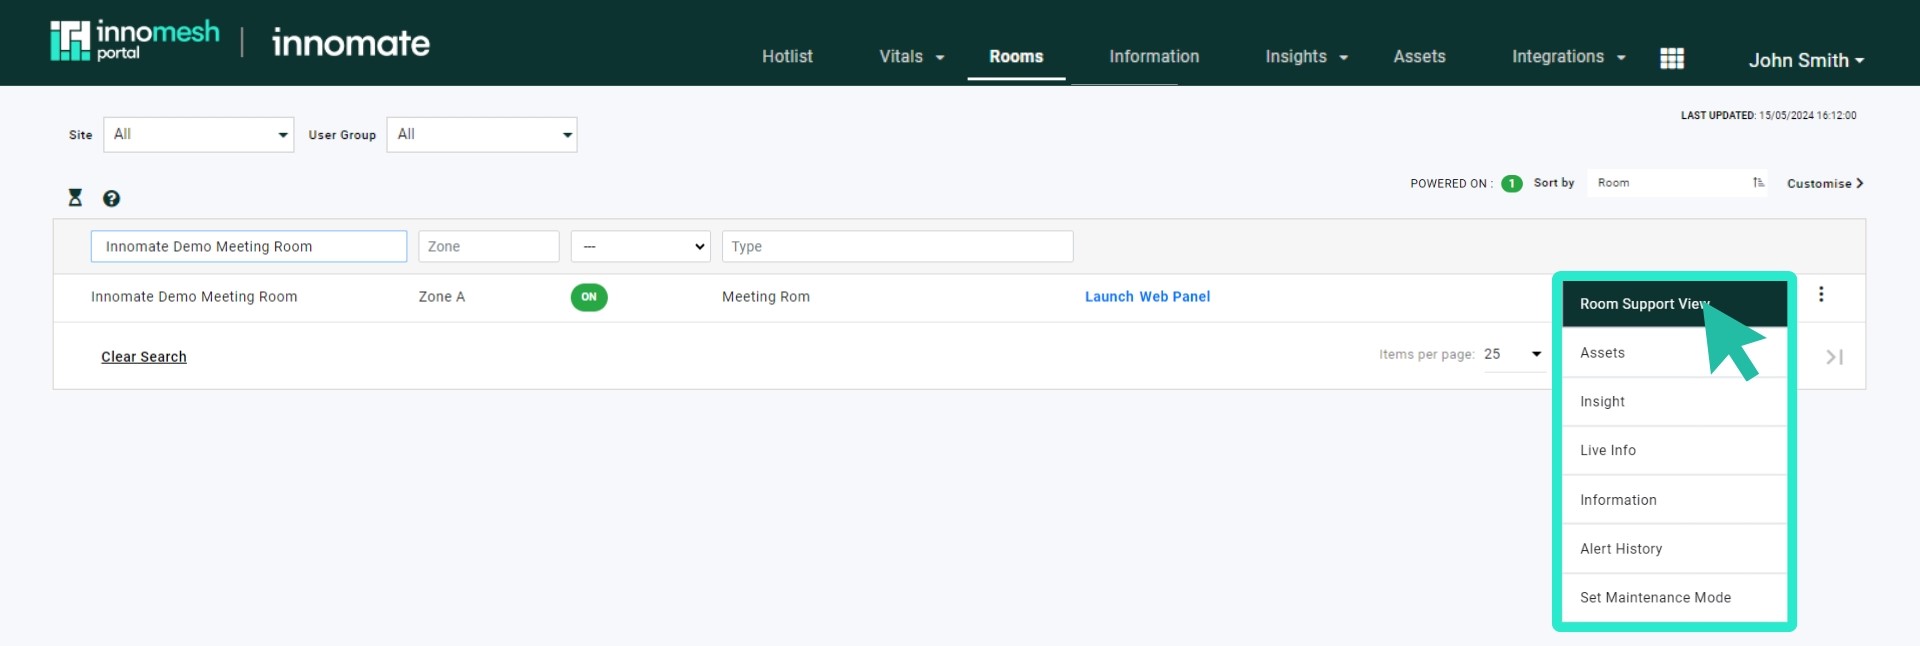
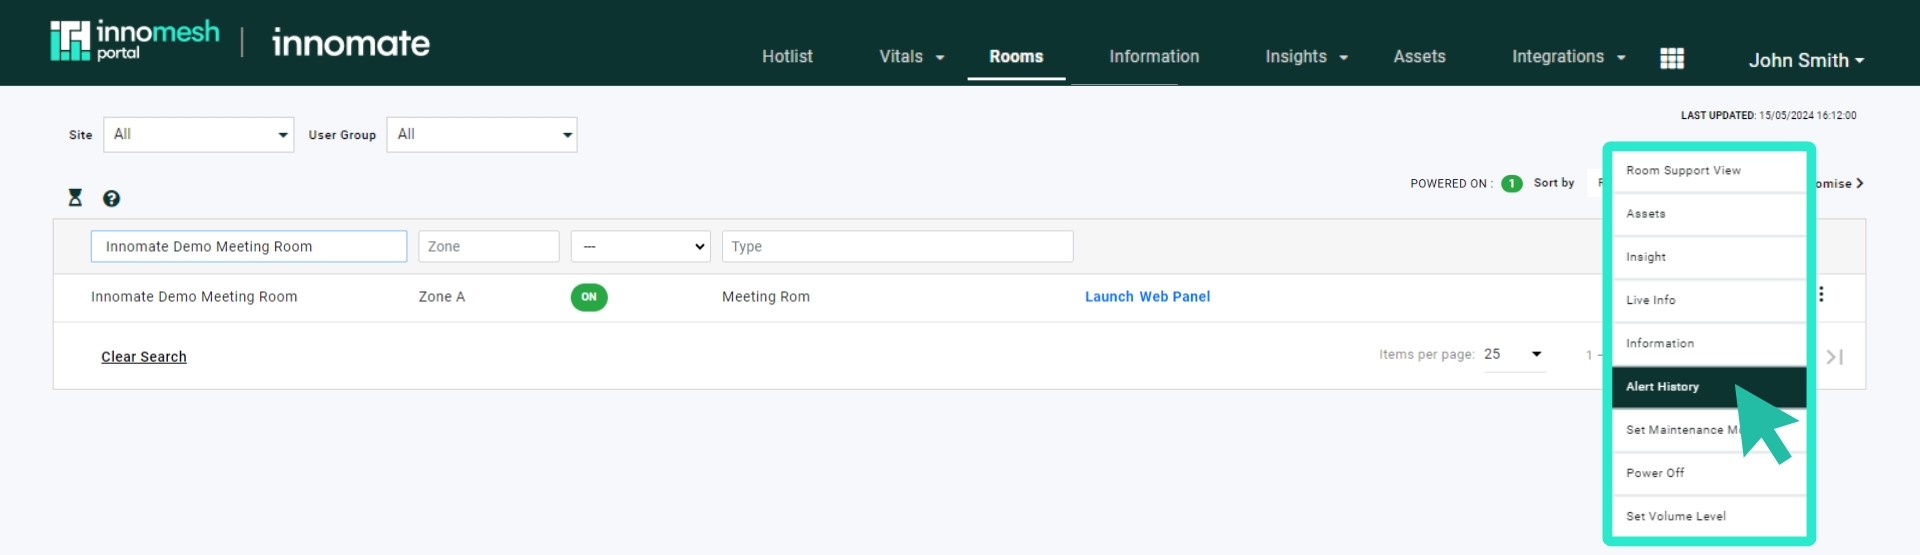
Room Support View
A unified dashboard providing comprehensive room information including assets, user interactions, maintenance controls, alerts, and quick access to room resources like cameras and schedules.
This “single pane of glass” provides a dashboard style overview of a room’s key information, providing a simple, powerful way for support teams to quickly understand all aspects of a room, and take effective action. Room Support View includes the room’s alerts and alert history, room assets, resources like room imagery, floorplans, the room’s location, and much more. It enhances operational efficiency when supporting a room, or when maintenance is required, and is a simple and effective source for gathering information.
To access a room’s Room Support View, click on any room in the Rooms tab; alternatively, hover over the room’s menu and click on “Room Support View”.
The Room Support View includes the following elements:
- Assets — displays all configured assets for the associated room.
- Interactions — a view of all user interactions through the room’s touch panel(s) or keypad.
- Launchpad — provides quick access options for common room functions, including:
- Maintenance Mode — put a room into and out of Maintenance Mode.
- View Room Insights — takes you to the room’s Insights page.
- View Live Info — shows the room’s Live Info page.
- View Room Camera — where available, accesses the room’s camera. The platform searches for and accesses the Information Portal hyperlink using the keyword “camera”, if one exists.
- View Room Schedule — where available, accesses the room’s schedule. The platform searches for and accesses the Information Portal hyperlink using the keyword “timetable”, if one exists.
- Launch Web Controls — where available, launches either the room’s Web Panel or XPanel.
- Hotlist/History — a view of the room’s current alerts and its alert history.
- Information — displays the room’s Static Information.
- Resources — displays the resources (files and hyperlinks) from the room’s Static Information.
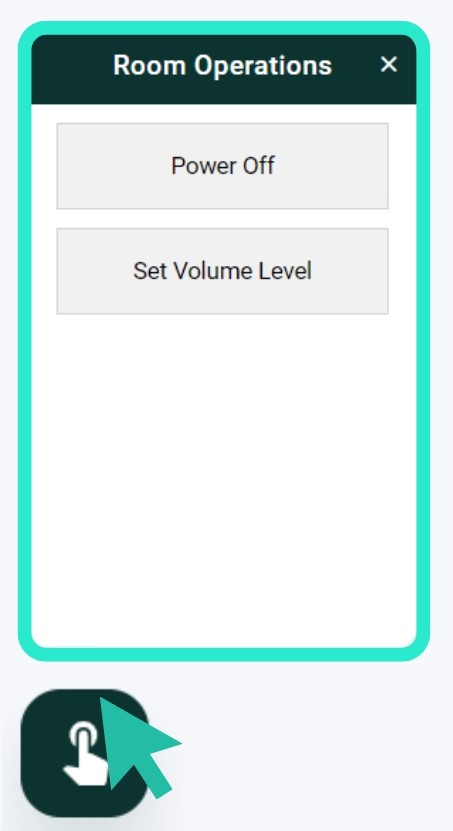
Room Operations
A sub-feature enabling support teams to trigger available room actions directly from the Room Support View interface.
You can access the Room Operations pane by clicking the icon displayed in the bottom left corner of your screen.
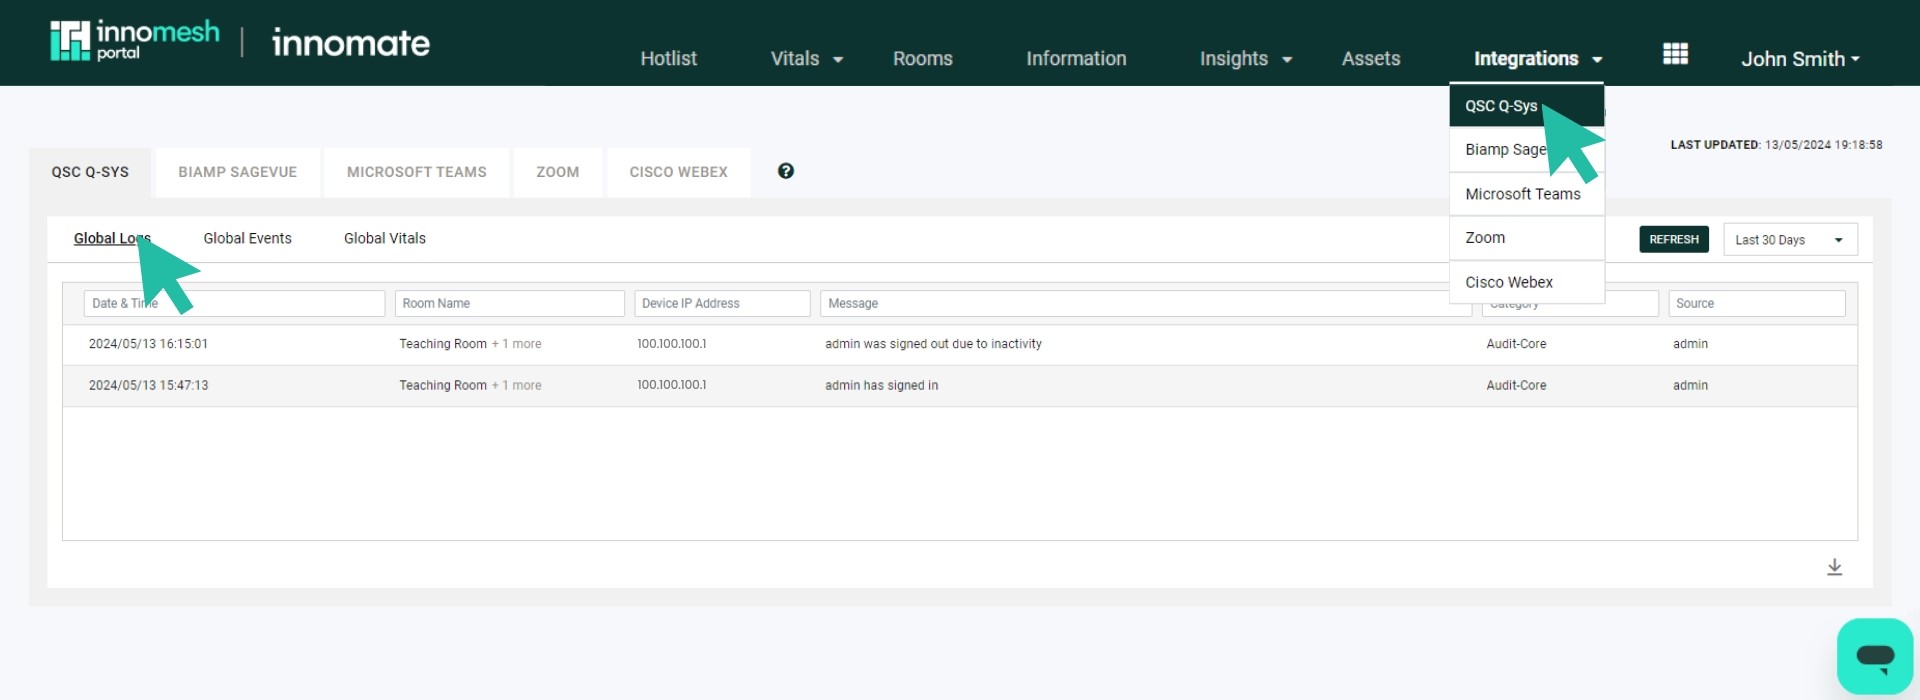
Q-Sys Interoperability
Comprehensive integration with Q-Sys environments featuring:
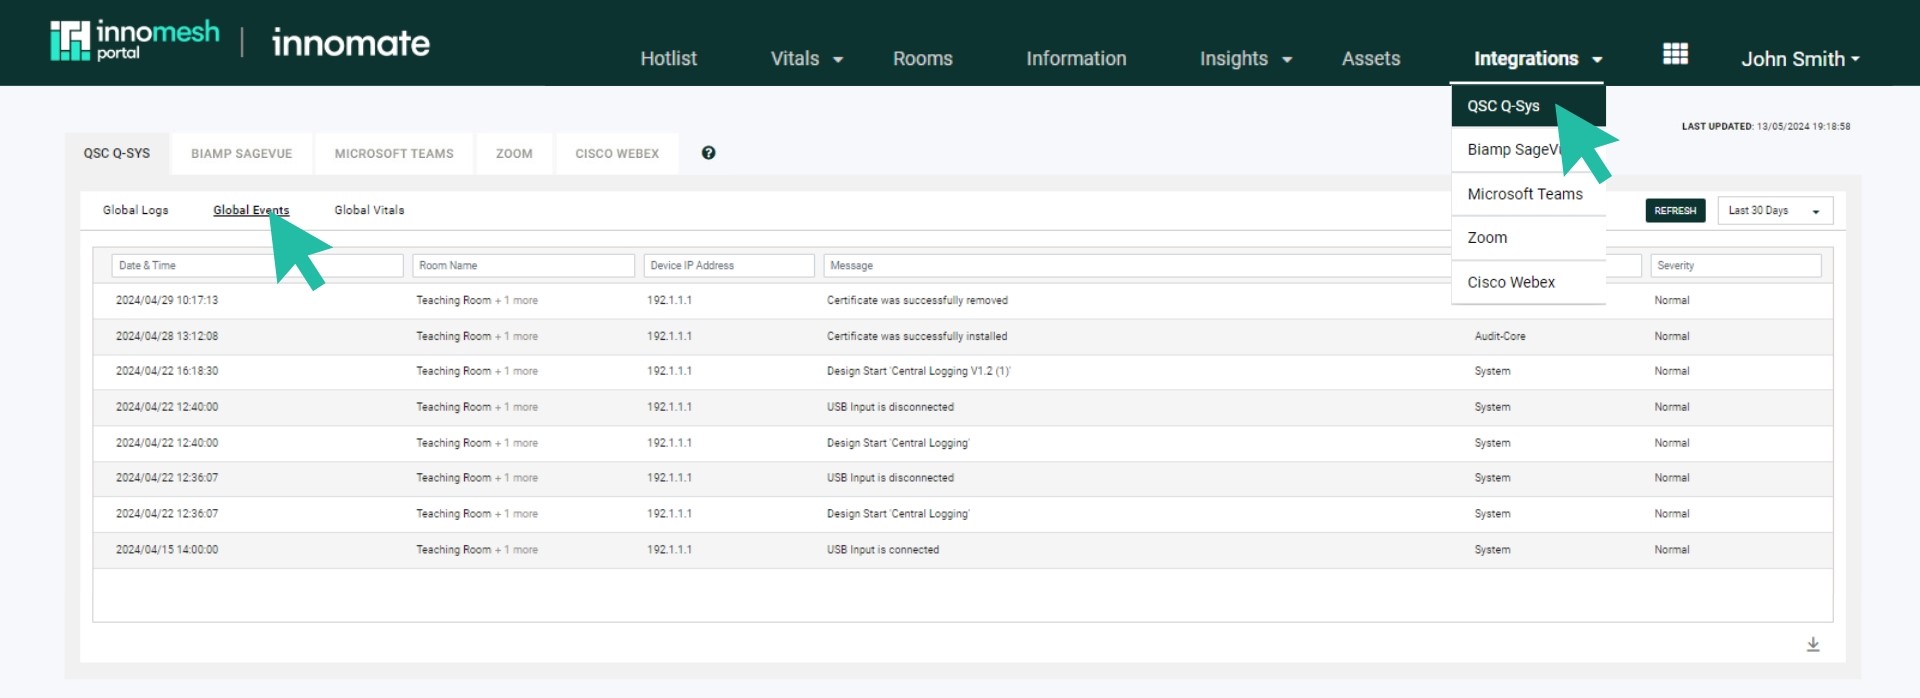
- Global Logs: Centralised logs pulled from every Q-Sys core in the environment, with advanced querying and filtering. Retention is a minimum of 3 months, up to a maximum of 365 days.
- Global Events: Events detected across all Q-Sys cores. Event types include:
- DSP Design Status — system initiation after firmware update or power reboot (shown as
Design Start [File Name]). - Grandmaster Clock Change — changes to a core’s Grandmaster clock.
- PTPv2 Offset Change — updates to the PTPv2 offset.
- USB Connection Status — USB input connect/disconnect events.
- Certificate Update — certificate installation or removal events.
- DSP Design Status — system initiation after firmware update or power reboot (shown as
- Live Messaging Notifications: Real-time alerts for BMCA Master Clock changes, PTPv1/PTPv2 changes, server configuration changes, authentication attempts (successful and failed), and vital metrics.
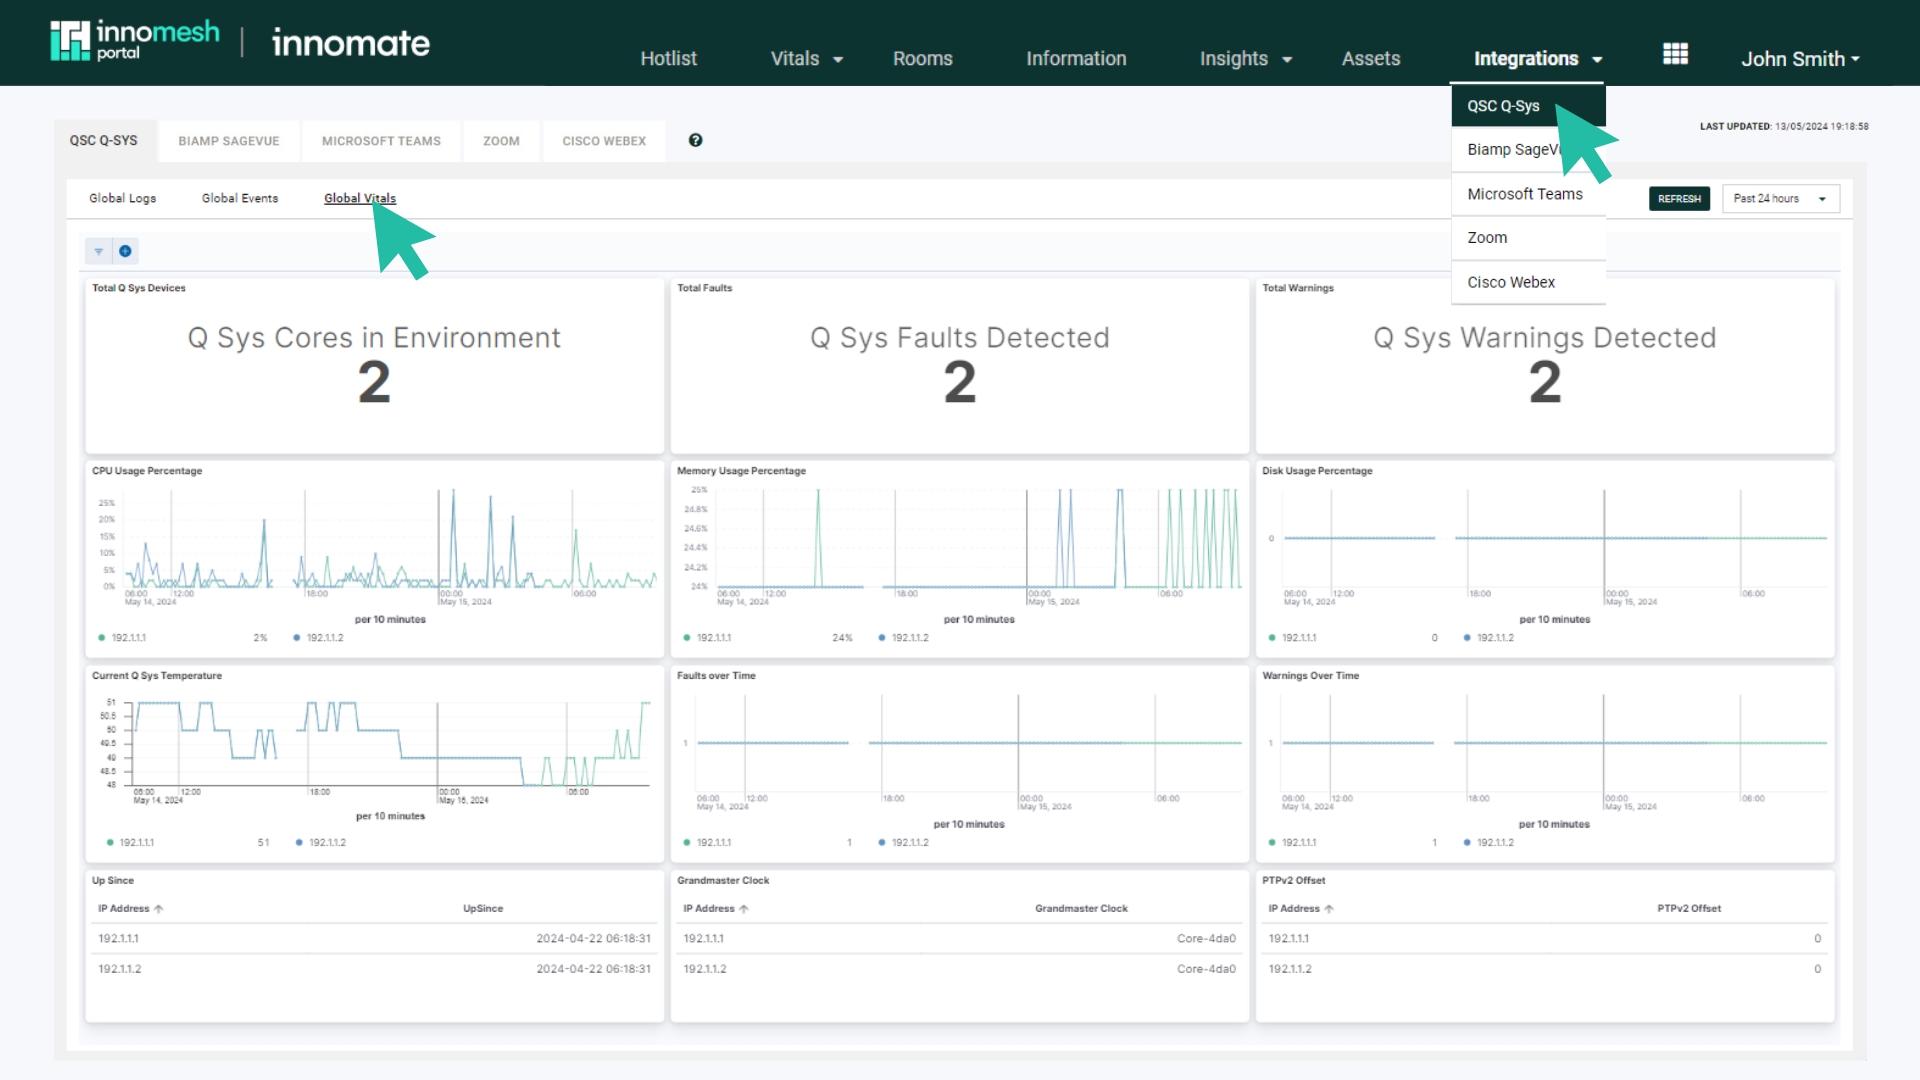
- Global Vitals Dashboard: Total Q-Sys Devices, Total Faults, Total Warnings, CPU Usage, Memory Usage, Disk Usage, Core Temperature, Up Since, Grandmaster Clock, and PTPv2 Offset. Faults, warnings, CPU, memory, disk, and temperature also appear in the Hotlist.
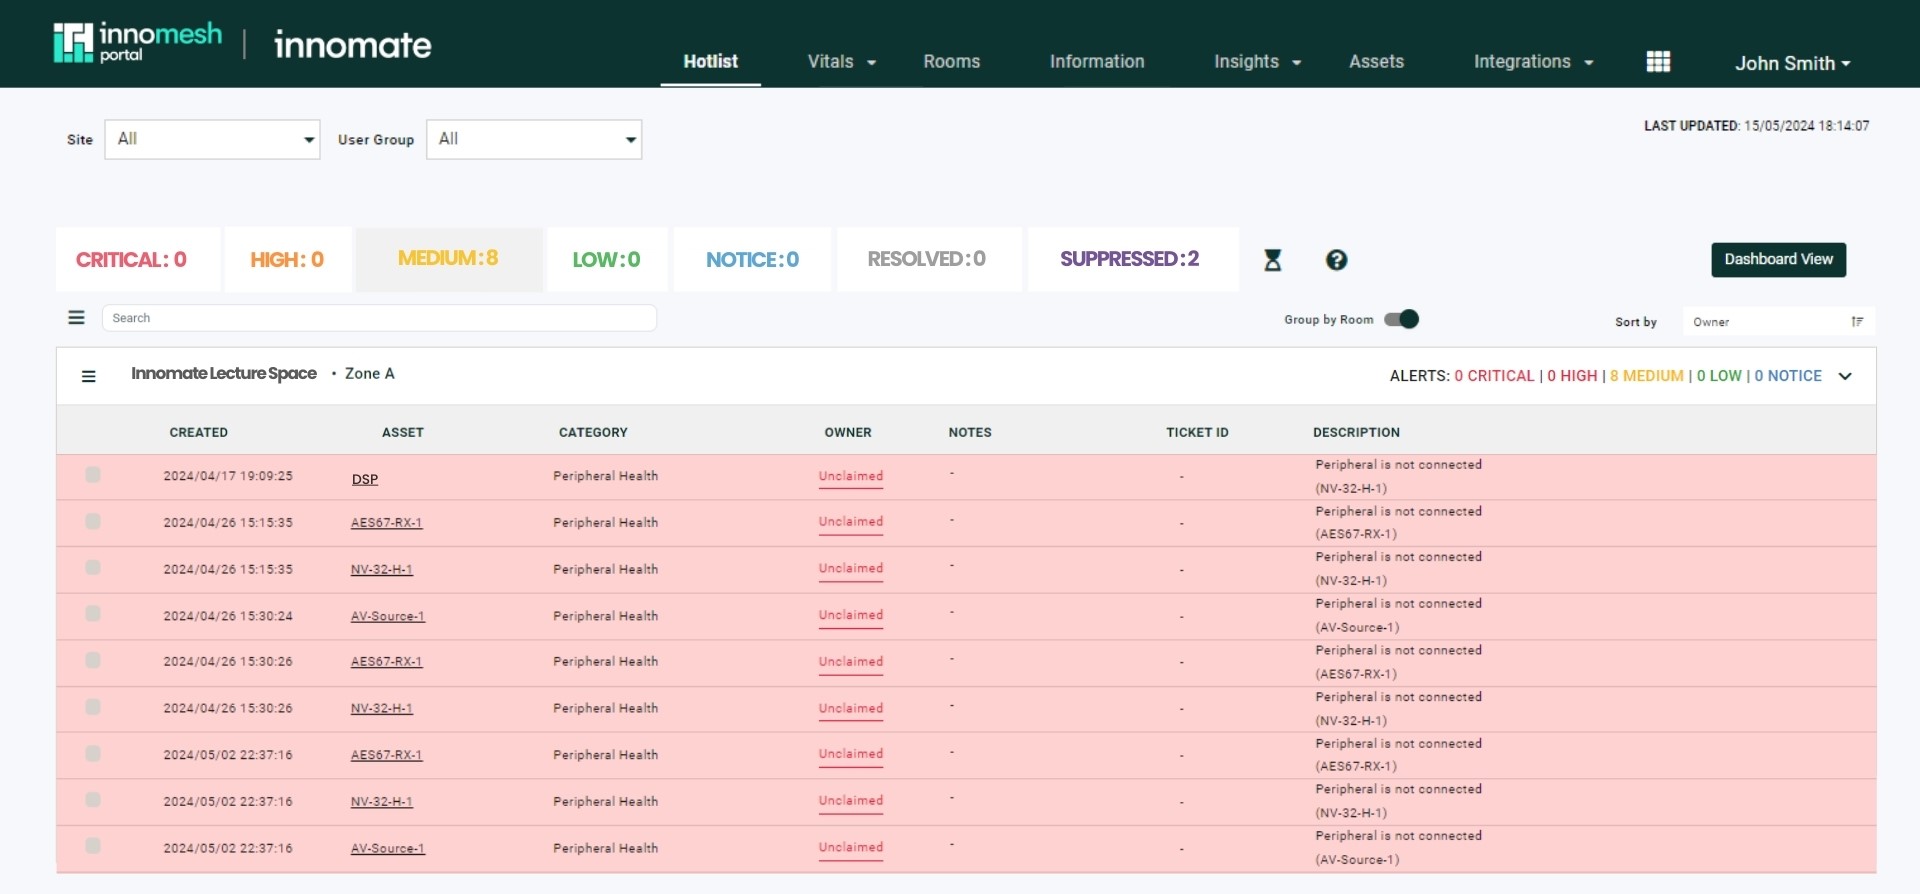
- Q-Sys Alerts: Hotlist integration for peripheral health, Grandmaster clock faults, core overheating, high CPU, high memory, and high storage usage.
- Core Operations: Reboot cores and upload or delete certificates from the Assets Registry.
- Peripheral Registry: Q-Sys peripherals now visible in the Assets Registry.
- Automated Configuration Management: Q-Sys server configurations regularly archived and versioned without human intervention.
Previously, a significant gap existed across environments with Q-Sys integrations, due to a lack of access to data across the Q-Sys ecosystem. This translated to a number of critical challenges for an AV environment in terms of availability, reporting, functionality, automation and observability constraints. With no notifications for server faults, complex manual troubleshooting processes, no tracking of Q-Sys server metrics, no central alerting, no historical audit trail or event visibility, and no automated configuration management on the Q-Sys servers, AV environments were being restricted and constrained, impacting service quality and operating costs.
With Innomesh’s rich integration to the Q-Sys ecosystem, the platform now provides true Q-Sys Interoperability across your environment, and enables a broad range of powerful functions and features. This is available in selected tenancies — contact the Innomesh team to learn more.
Q-Sys Interoperability can be accessed through a new “Integrations” menu within Innomesh Portal, as well as through the Innomesh Portal Assets Registry. The feature allows you to view and search all logs, events, insights and files gathered from Q-Sys devices, ensuring that widespread Q-Sys outages can be diagnosed and addressed rapidly.
Q-Sys Global Logs
This view shows the logs pulled from every Q-Sys core within your AV environment, and allows you to filter and analyse all logs from all devices in one view. You will now have advanced querying and filtering capabilities across Q-Sys logs for your entire environment, enabling much faster troubleshooting. You also now have a minimum of three months logging capacity, with a current maximum of 365 days, which enables historical troubleshooting of metrics and events, providing a robust audit trail.
Q-Sys Global Events
This view displays all events that have been detected across all Q-Sys cores across your AV environment. All Q-Sys events will also trigger a live messaging alert for your support team via your organisation’s live messaging platform (e.g. Slack or Microsoft Teams). Please note that Global Events include all activities from Global Logs.
Q-Sys Global Vitals
Q-Sys Interoperability also enables automated live analysis, including automated fault detection, based on defined data trends such as PTP and BMCA conflicts. The Global Vitals dashboard provides a visualisation of data gathered from all Q-Sys devices across your environment.
Q-Sys Centric Alerts in Hotlist
You will now see all Q-Sys centric alerts related to Q-Sys cores and their peripherals included in the Hotlist.
Q-Sys Core Ops
This feature allows you to trigger Ops actions specific to Q-Sys from the Innomesh Portal Assets Registry, just as you are used to doing for all other Ops actions. You now have the ability to reboot a core, and the ability to upload or delete certificates.
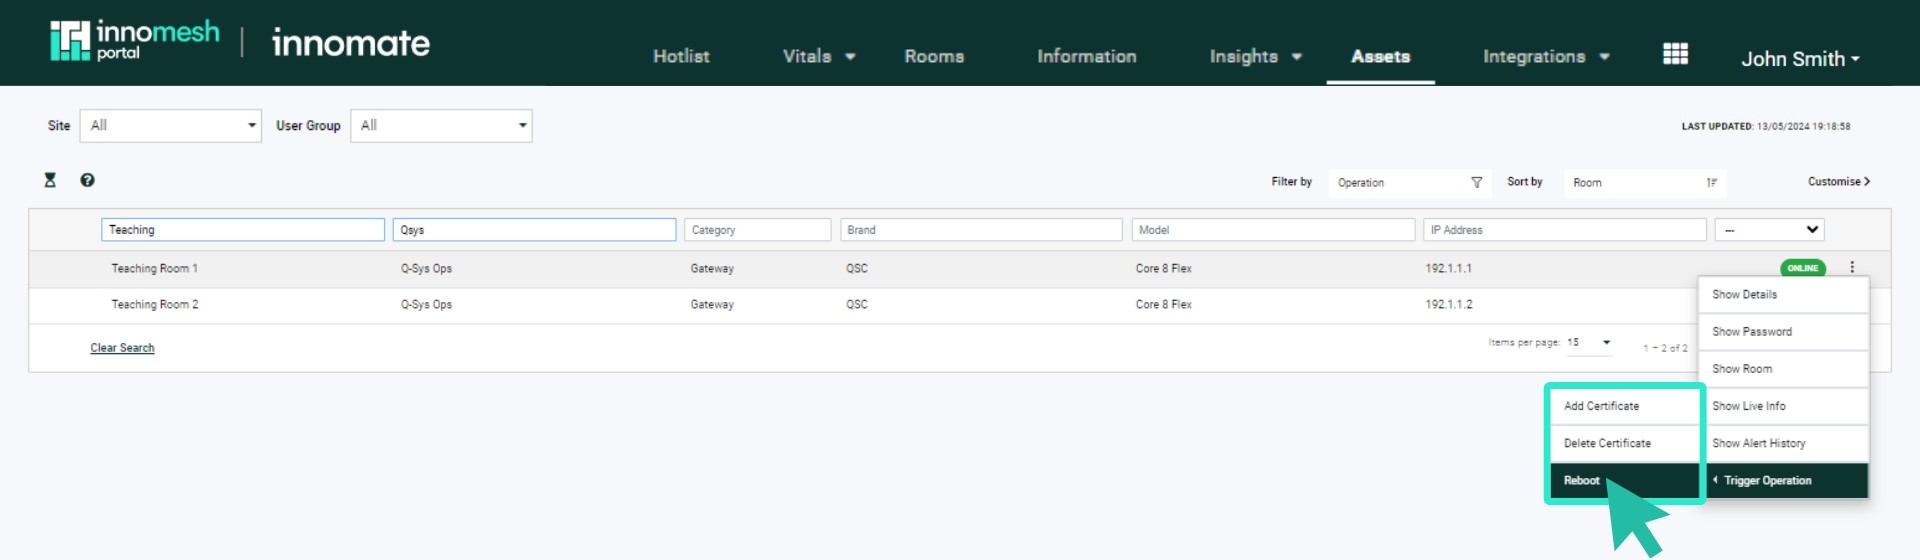
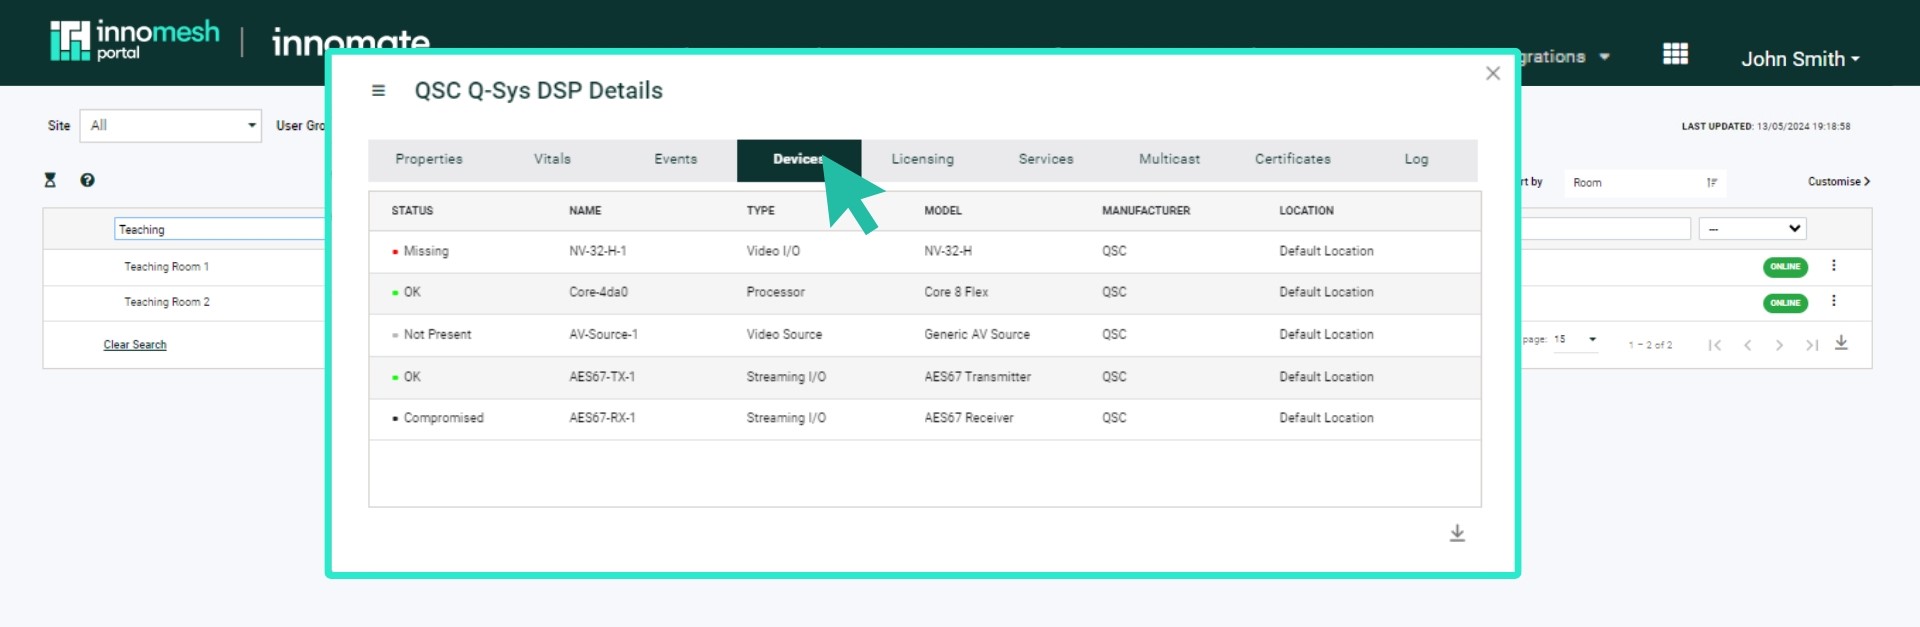
Q-Sys Peripherals
Q-Sys peripherals, gathered using Q-Sys device information, are now included as part of the Innomesh Portal Asset Registry.
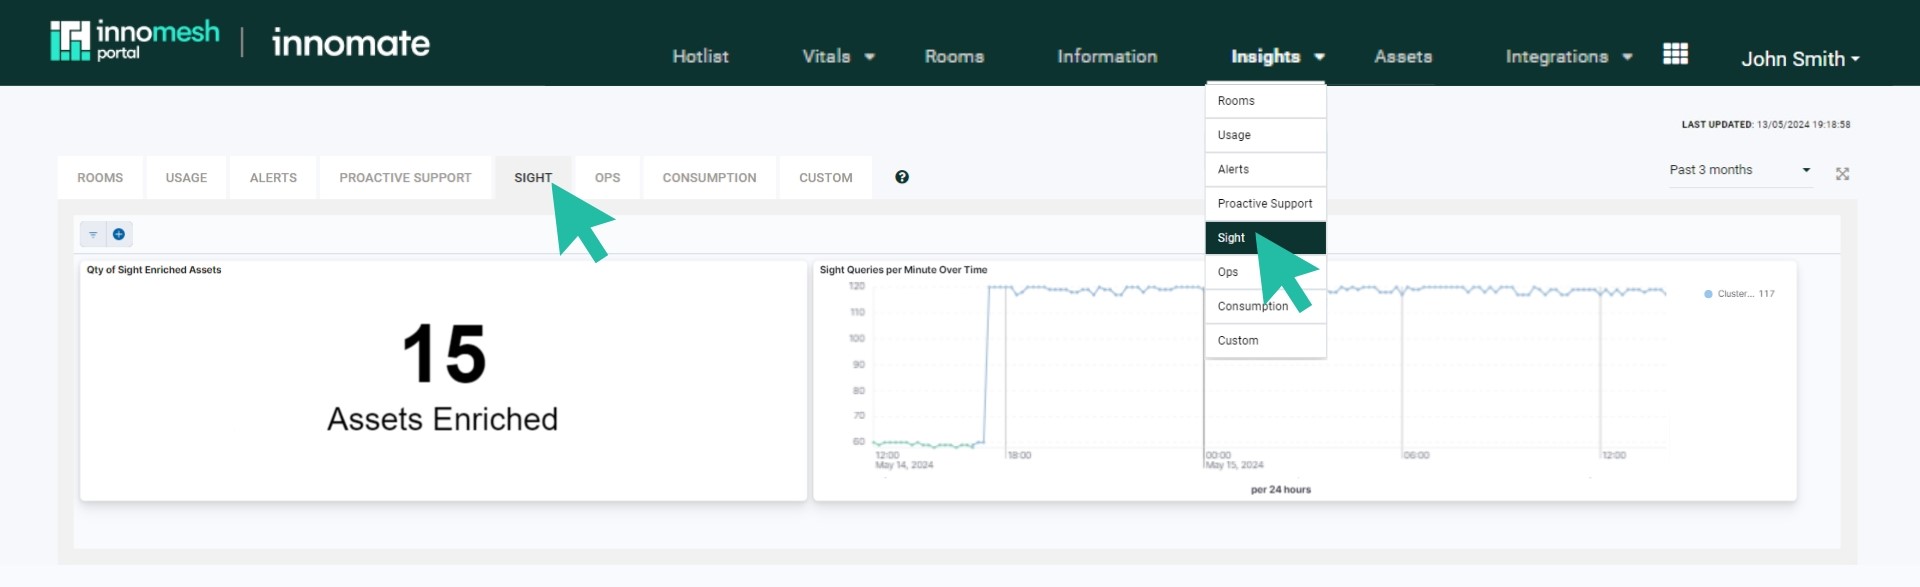
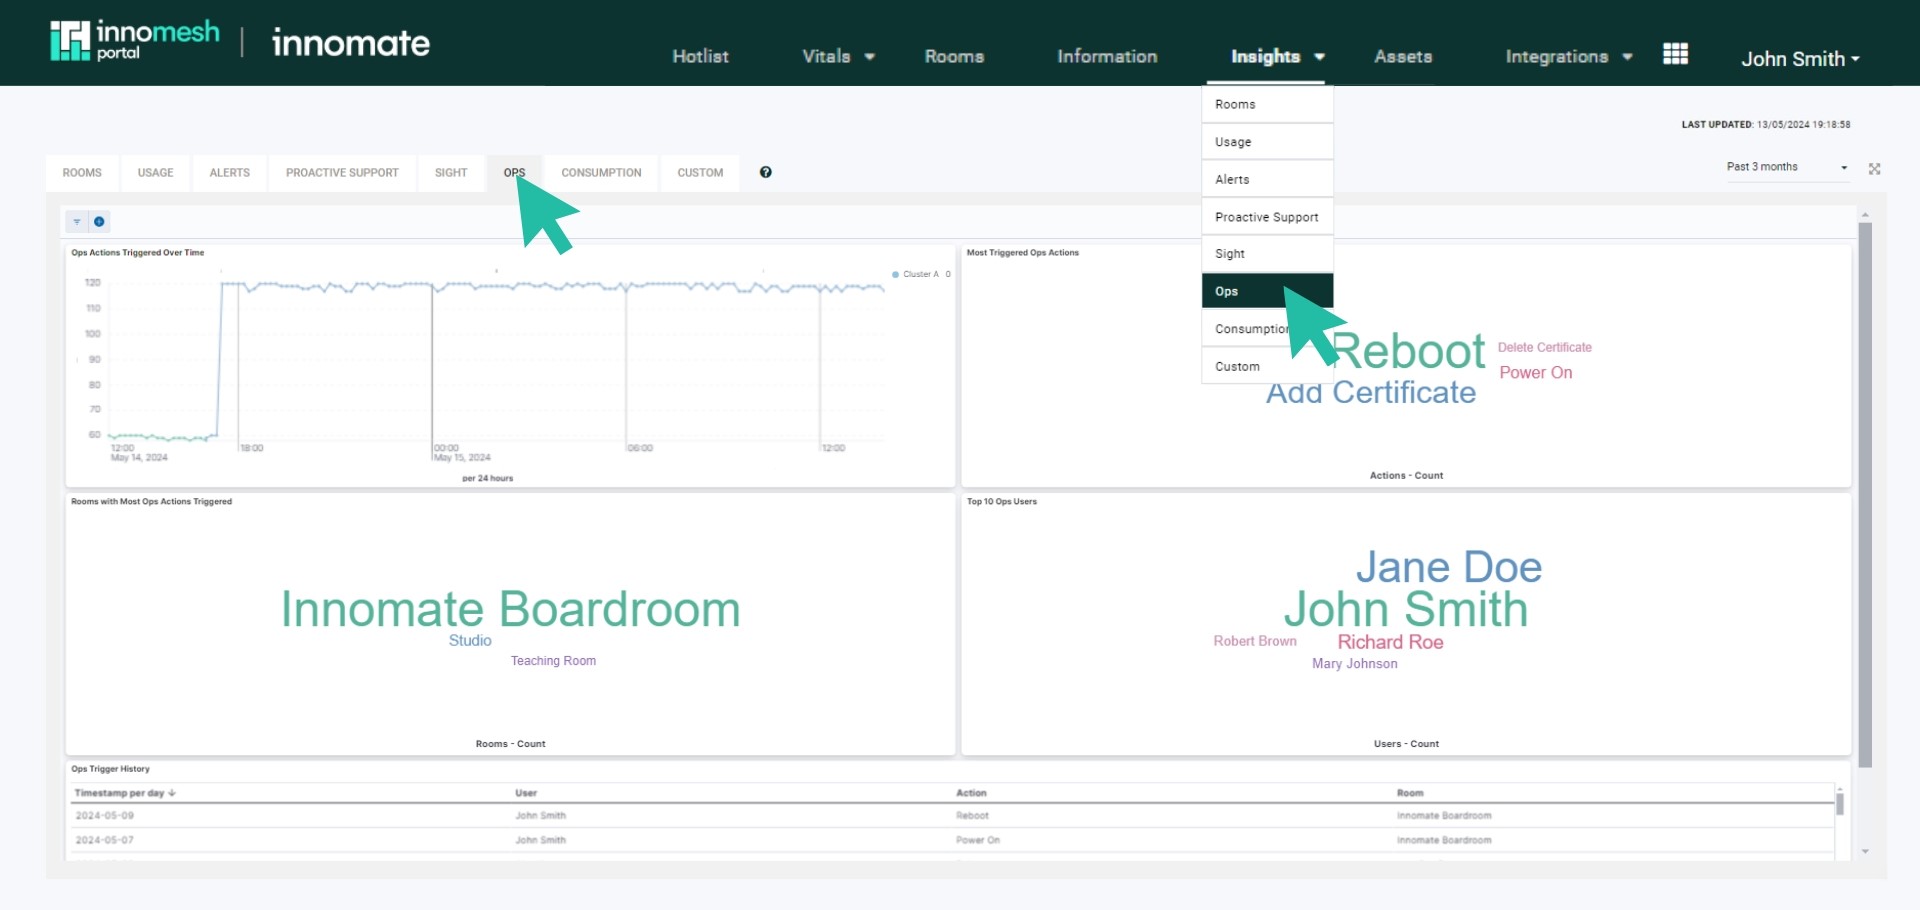
Enhanced Metrics Dashboards
New visualisations for Sight and Ops showing CPU, memory usage, query processing metrics, error logging, and response times.
Additional Alerts
New Hotlist alerts for Sight connection/authentication failures and room-level CPU utilisation thresholds (medium at 6%, high at 12%).
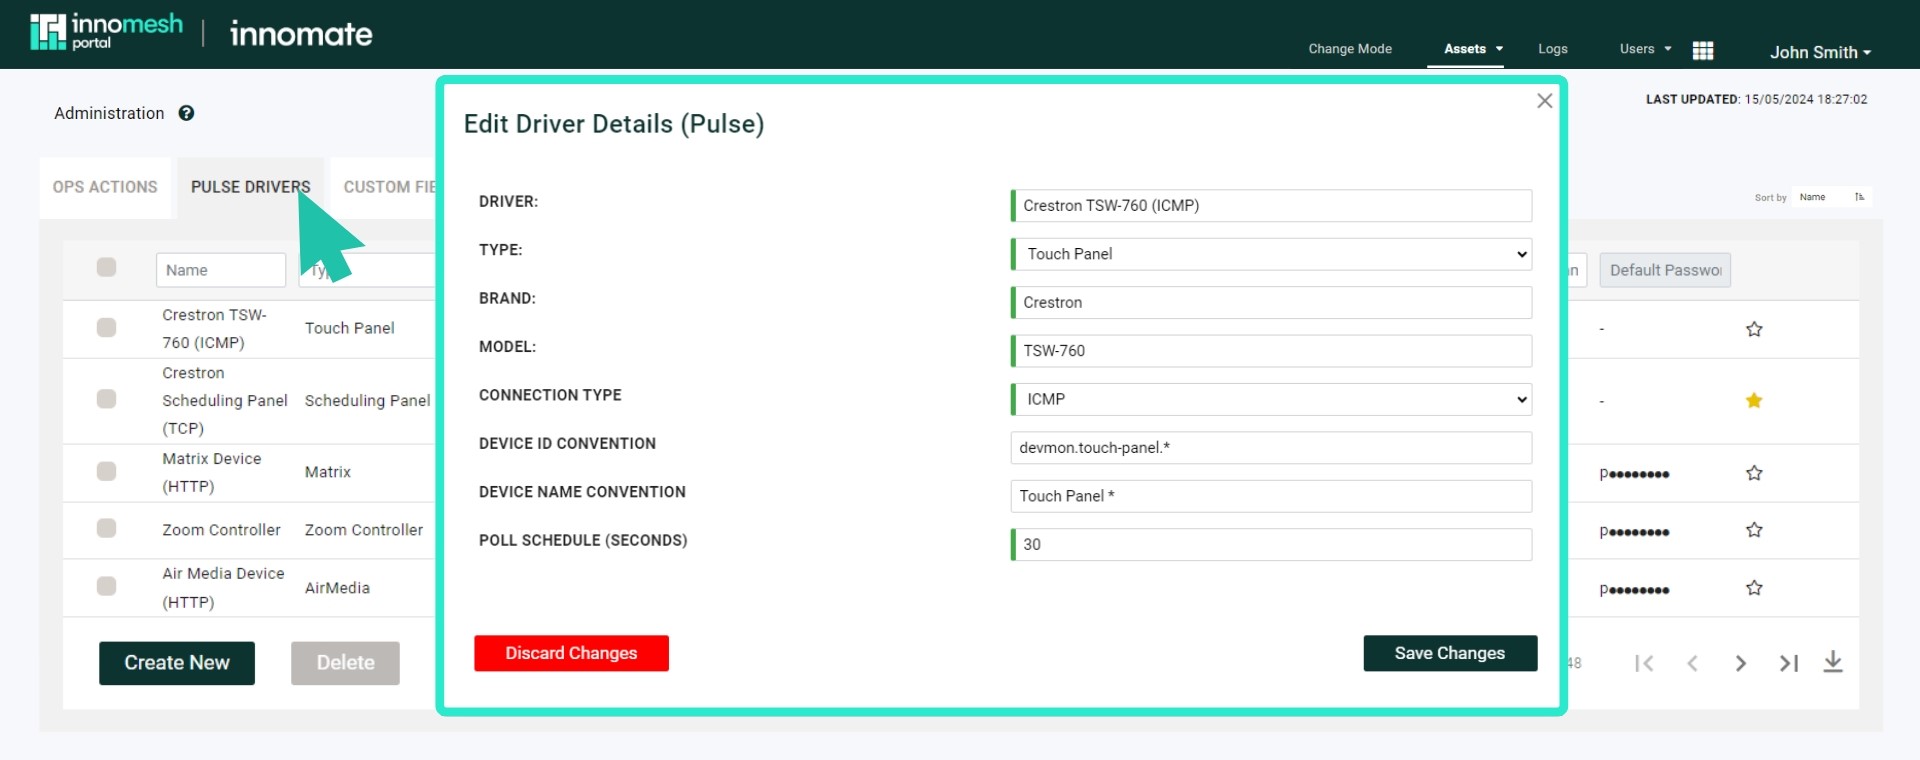
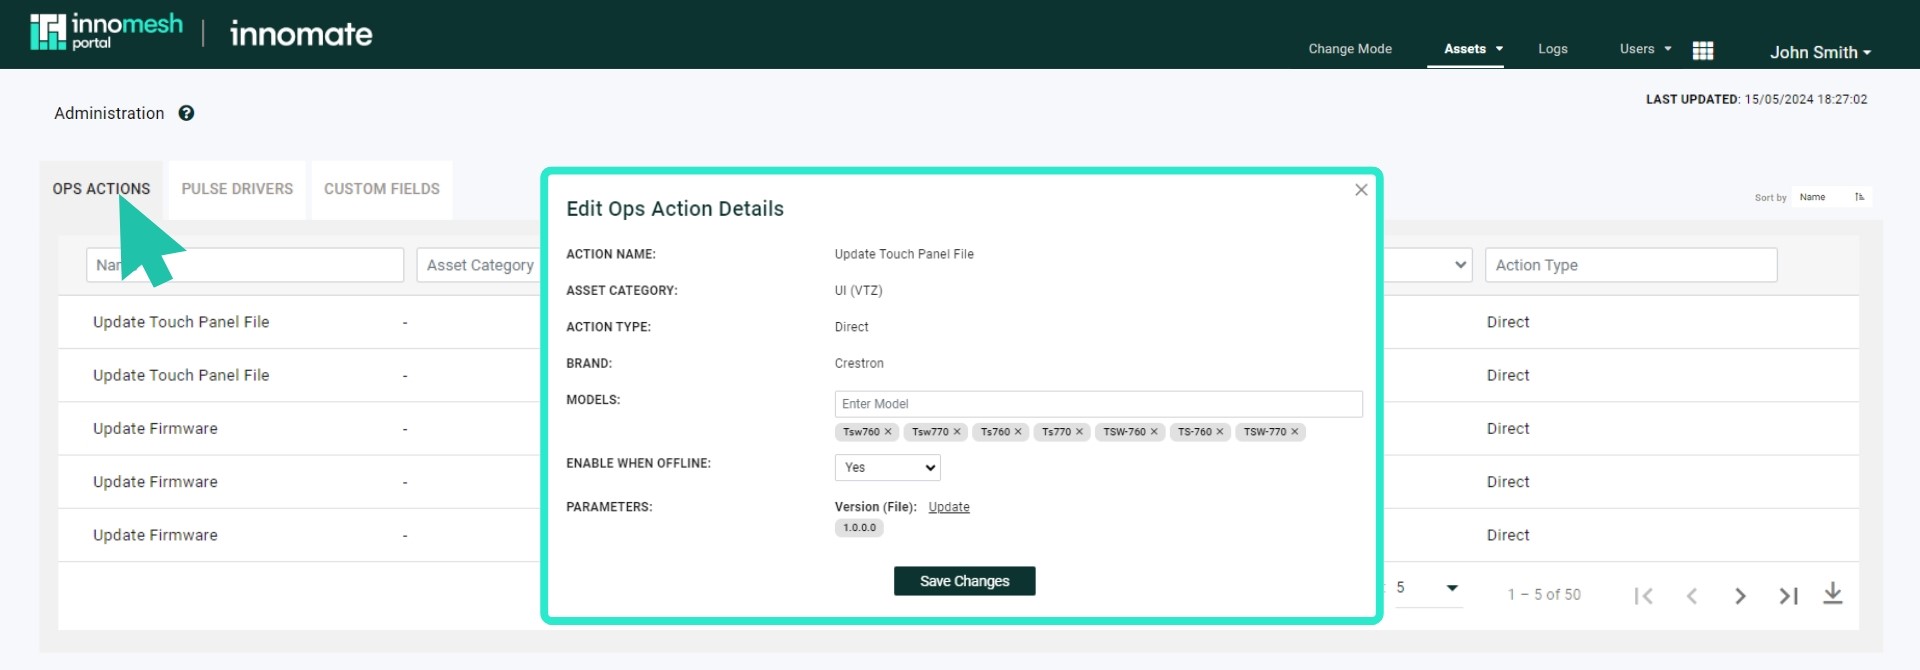
Administrative Capabilities
- Pulse driver management from Portal.
- Ops file uploads and action management.
- Room alert history access.
Host CPU Alerts
Host CPU alerts now use a 2-minute threshold to prevent one-off spikes from triggering critical alerts.
Room Manager Features
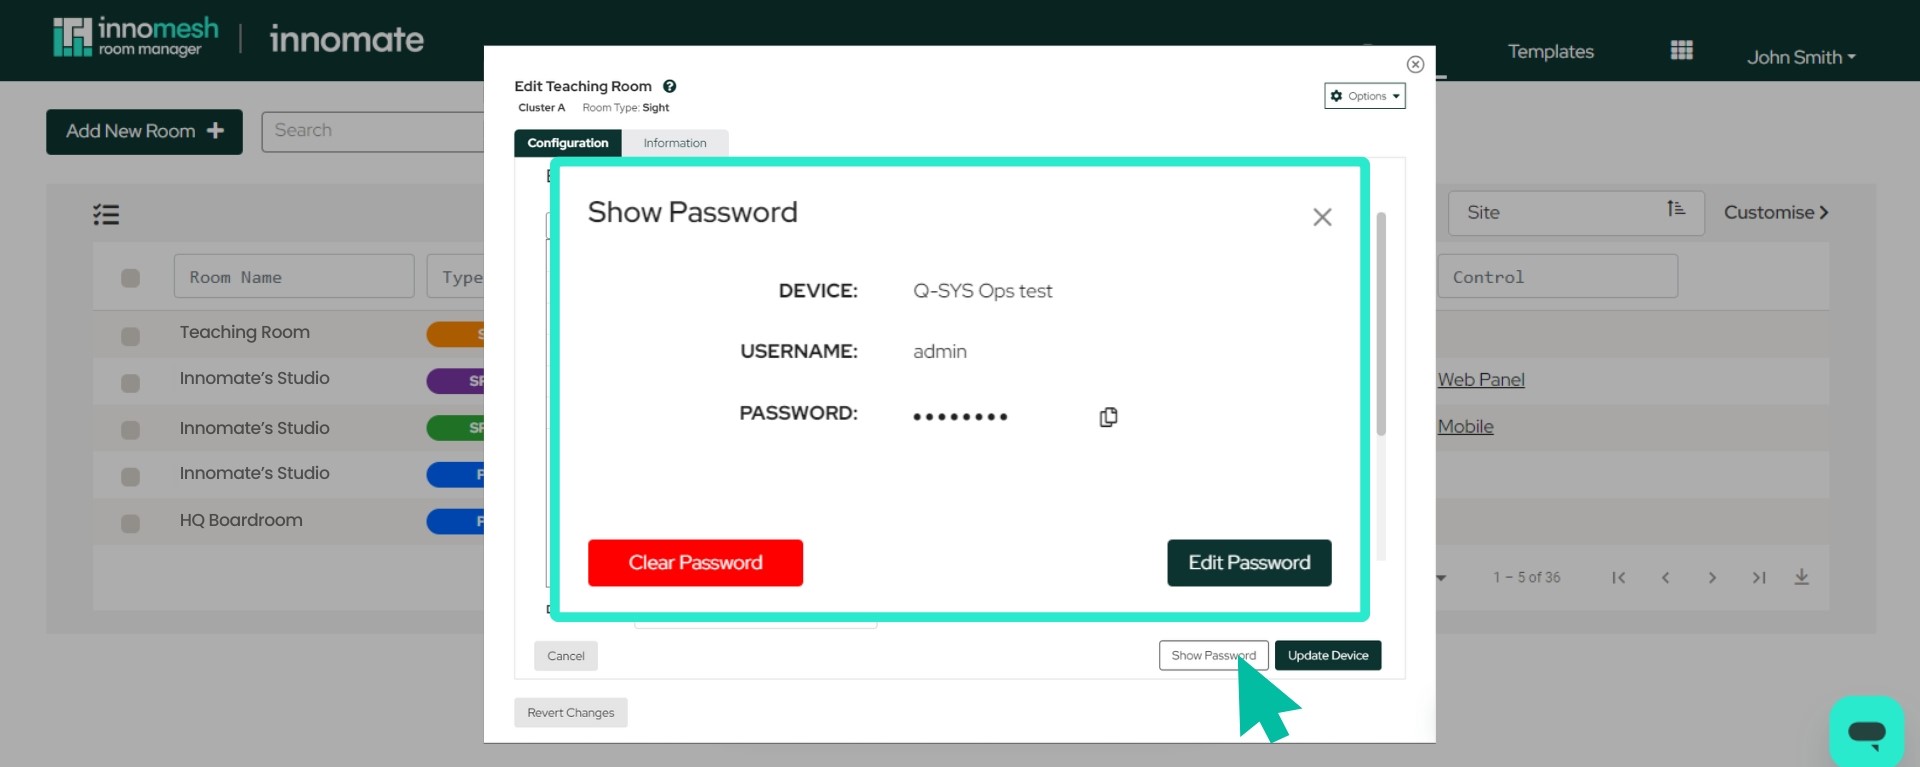
Password Management
Direct password configuration for Sight devices within the room settings interface.
Mass Upgrade/Downgrade
Ability to efficiently upgrade devices from Pulse to Sight or downgrade in bulk operations.
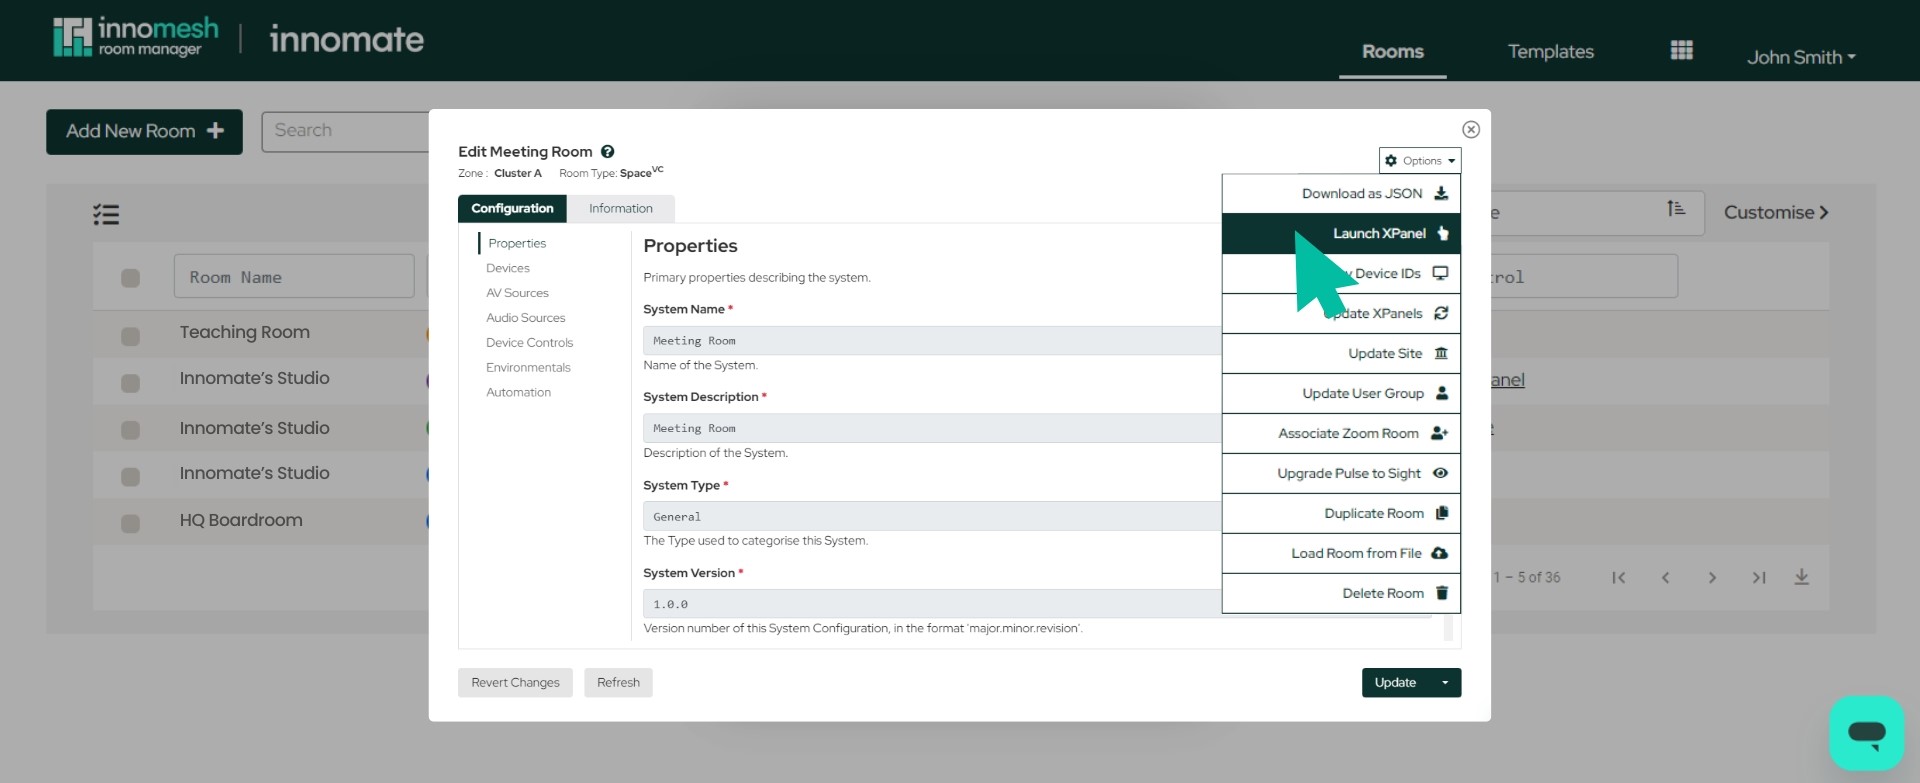
Panel Access
Quick launch options for XPanel, VNC, or Web Panel directly from the Options menu.
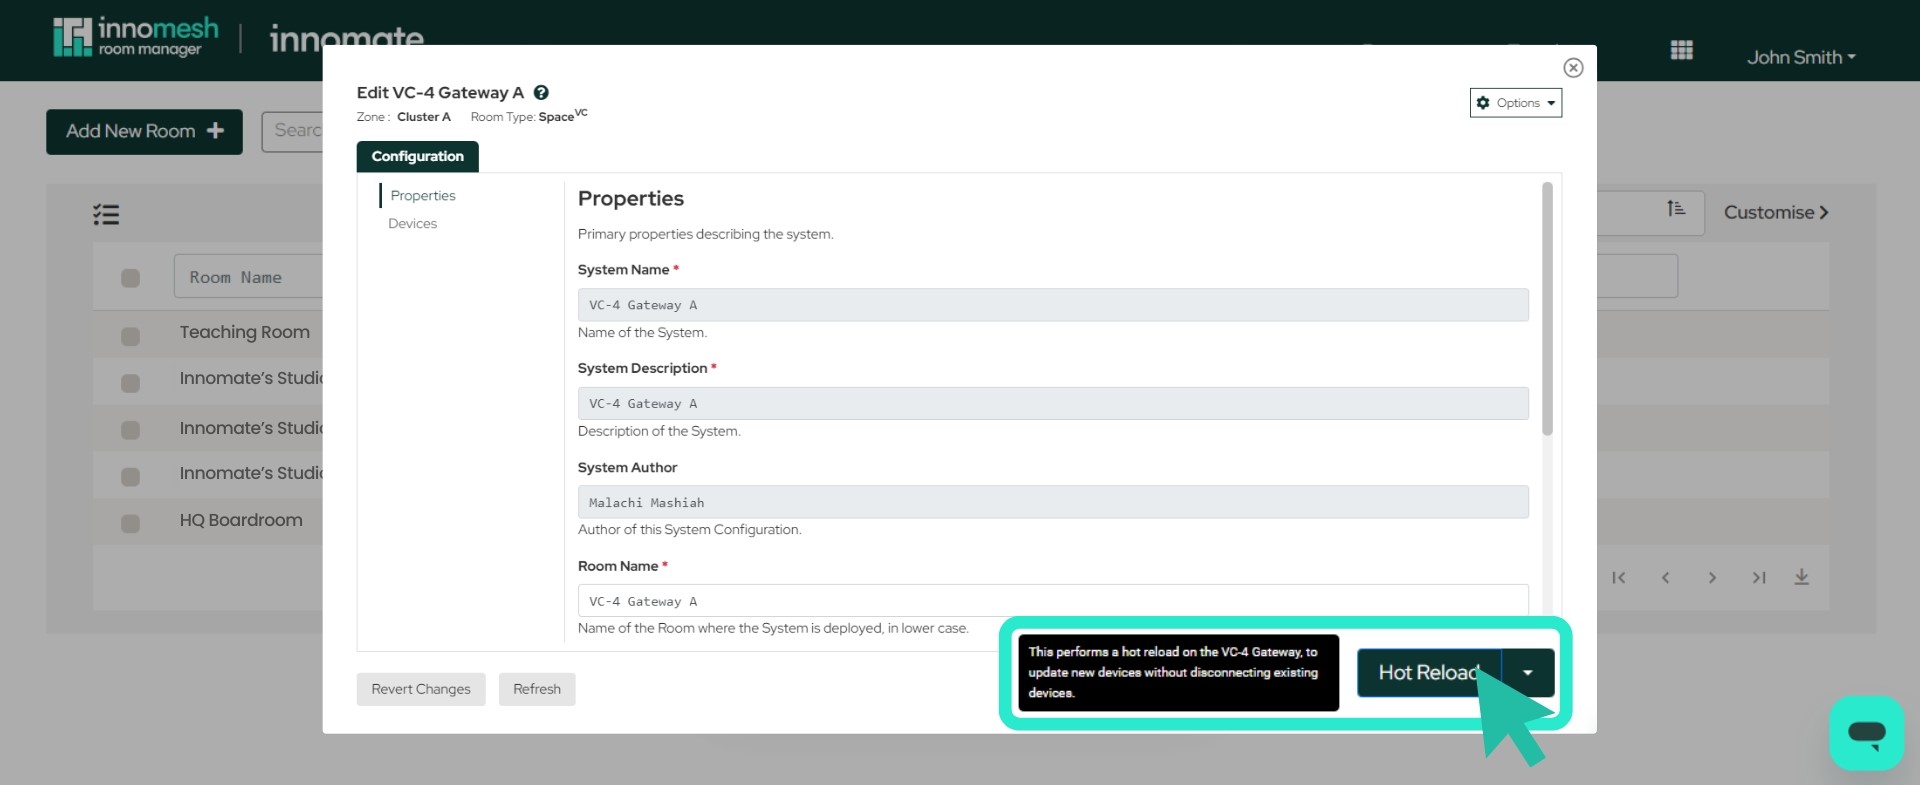
VC-4 Gateway Hot Reload
Default hot reload capability enabling device updates without disconnecting existing connections. Hot reload is now the default option, but you can still action a conventional update via the dropdown menu.
Bug Fixes
- Sight rooms are now Site-aware, fixing an integrity issue with room display in the Portal Room Registry.
- Fixed Asset Live Information where certain fields were not showing.
- Resolved an issue with VC-4 Gateway Hot Reload causing an unintended full restart.
- Rectified the Hotlist Dashboard’s “return” workflow.
- Fixed a user logout flow bug in Room Manager and Portal where logging out would log the user straight back in.
- Fixed a bug in the Information Portal where a search field entered before the page finished loading would erroneously appear in the “Room” filter.
- Fixed an asset field editing bug in the Assets Registry where clicking outside the edit window closed it unexpectedly and discarded unsaved changes.
- Portal Hotlist now gracefully handles race conditions when a user update to an alert (e.g. claiming it) happens concurrently with automatic resolution.
- Room and system template IDs (repository names) in Room Manager now warn the user when length exceeds the allowable limit (between 52 and 62 characters, depending on room type).