The Vitals page provides system performance metrics across infrastructure, rooms, network, and monitoring components. It enables proactive issue detection and system optimisation by surfacing health data in near real time.
Infrastructure
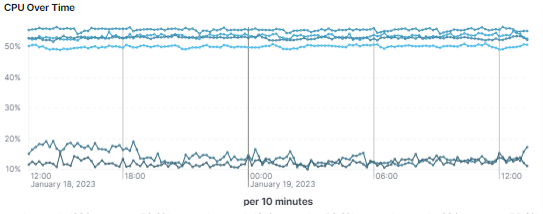
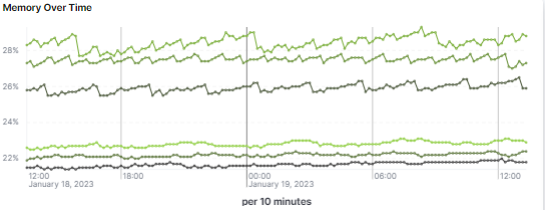
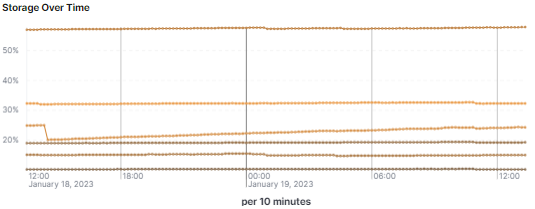
Monitors server performance through several key metrics:

- CPU Over Time displays server CPU usage patterns.
- Memory Over Time tracks server memory consumption.
- Storage Over Time shows available storage utilisation across servers.
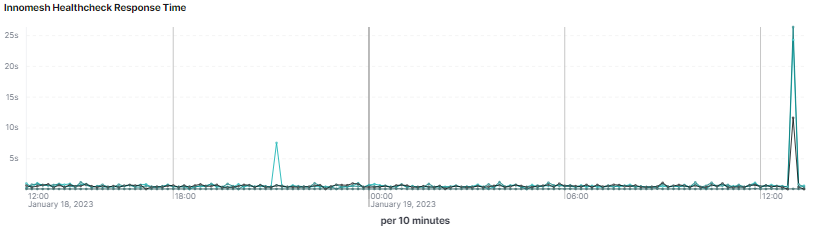
- Innomesh Healthcheck Response Time measures room responsiveness to detect potential problems early.
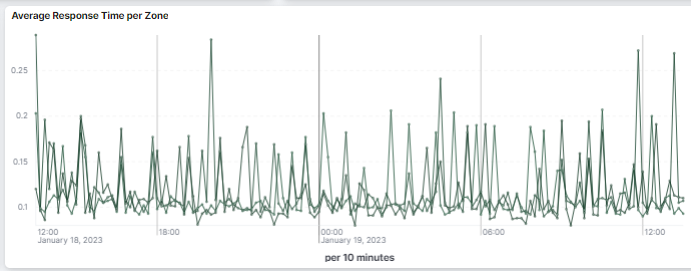
- Average Response Time per Zone identifies trends and patterns by geographic zone.
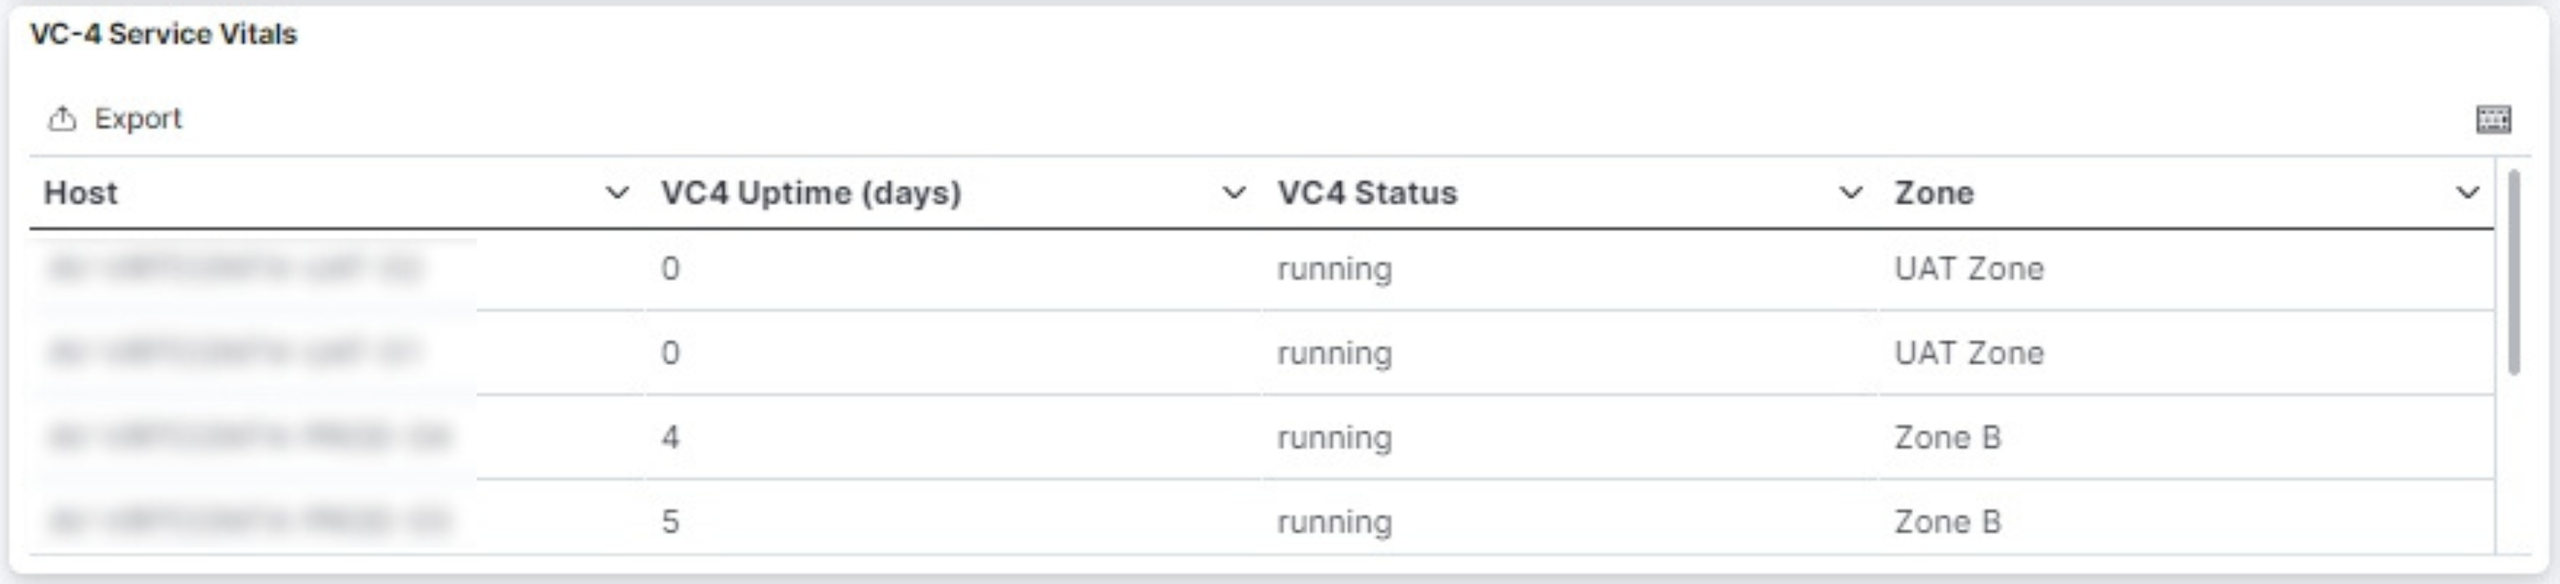
- VC-4 Service Vitals lists all VC-4 servers with uptime, status, and zone information (exportable).
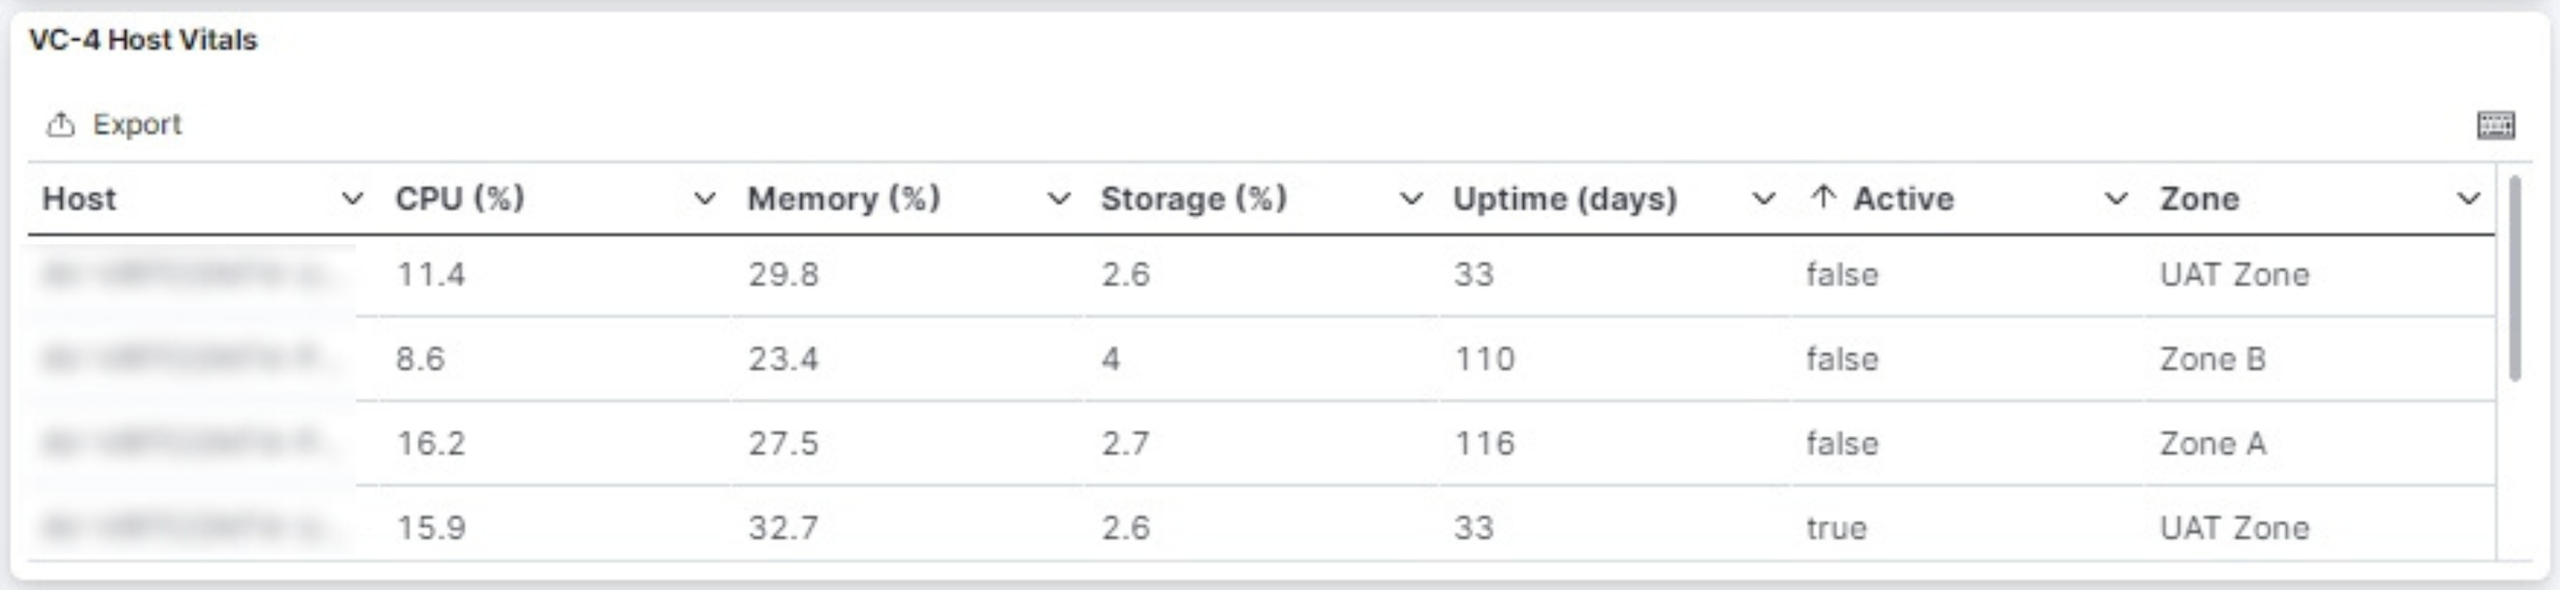
- VC-4 Host Vitals shows server active status and vital statistics.
Rooms
Provides operational insights on room status and equipment:
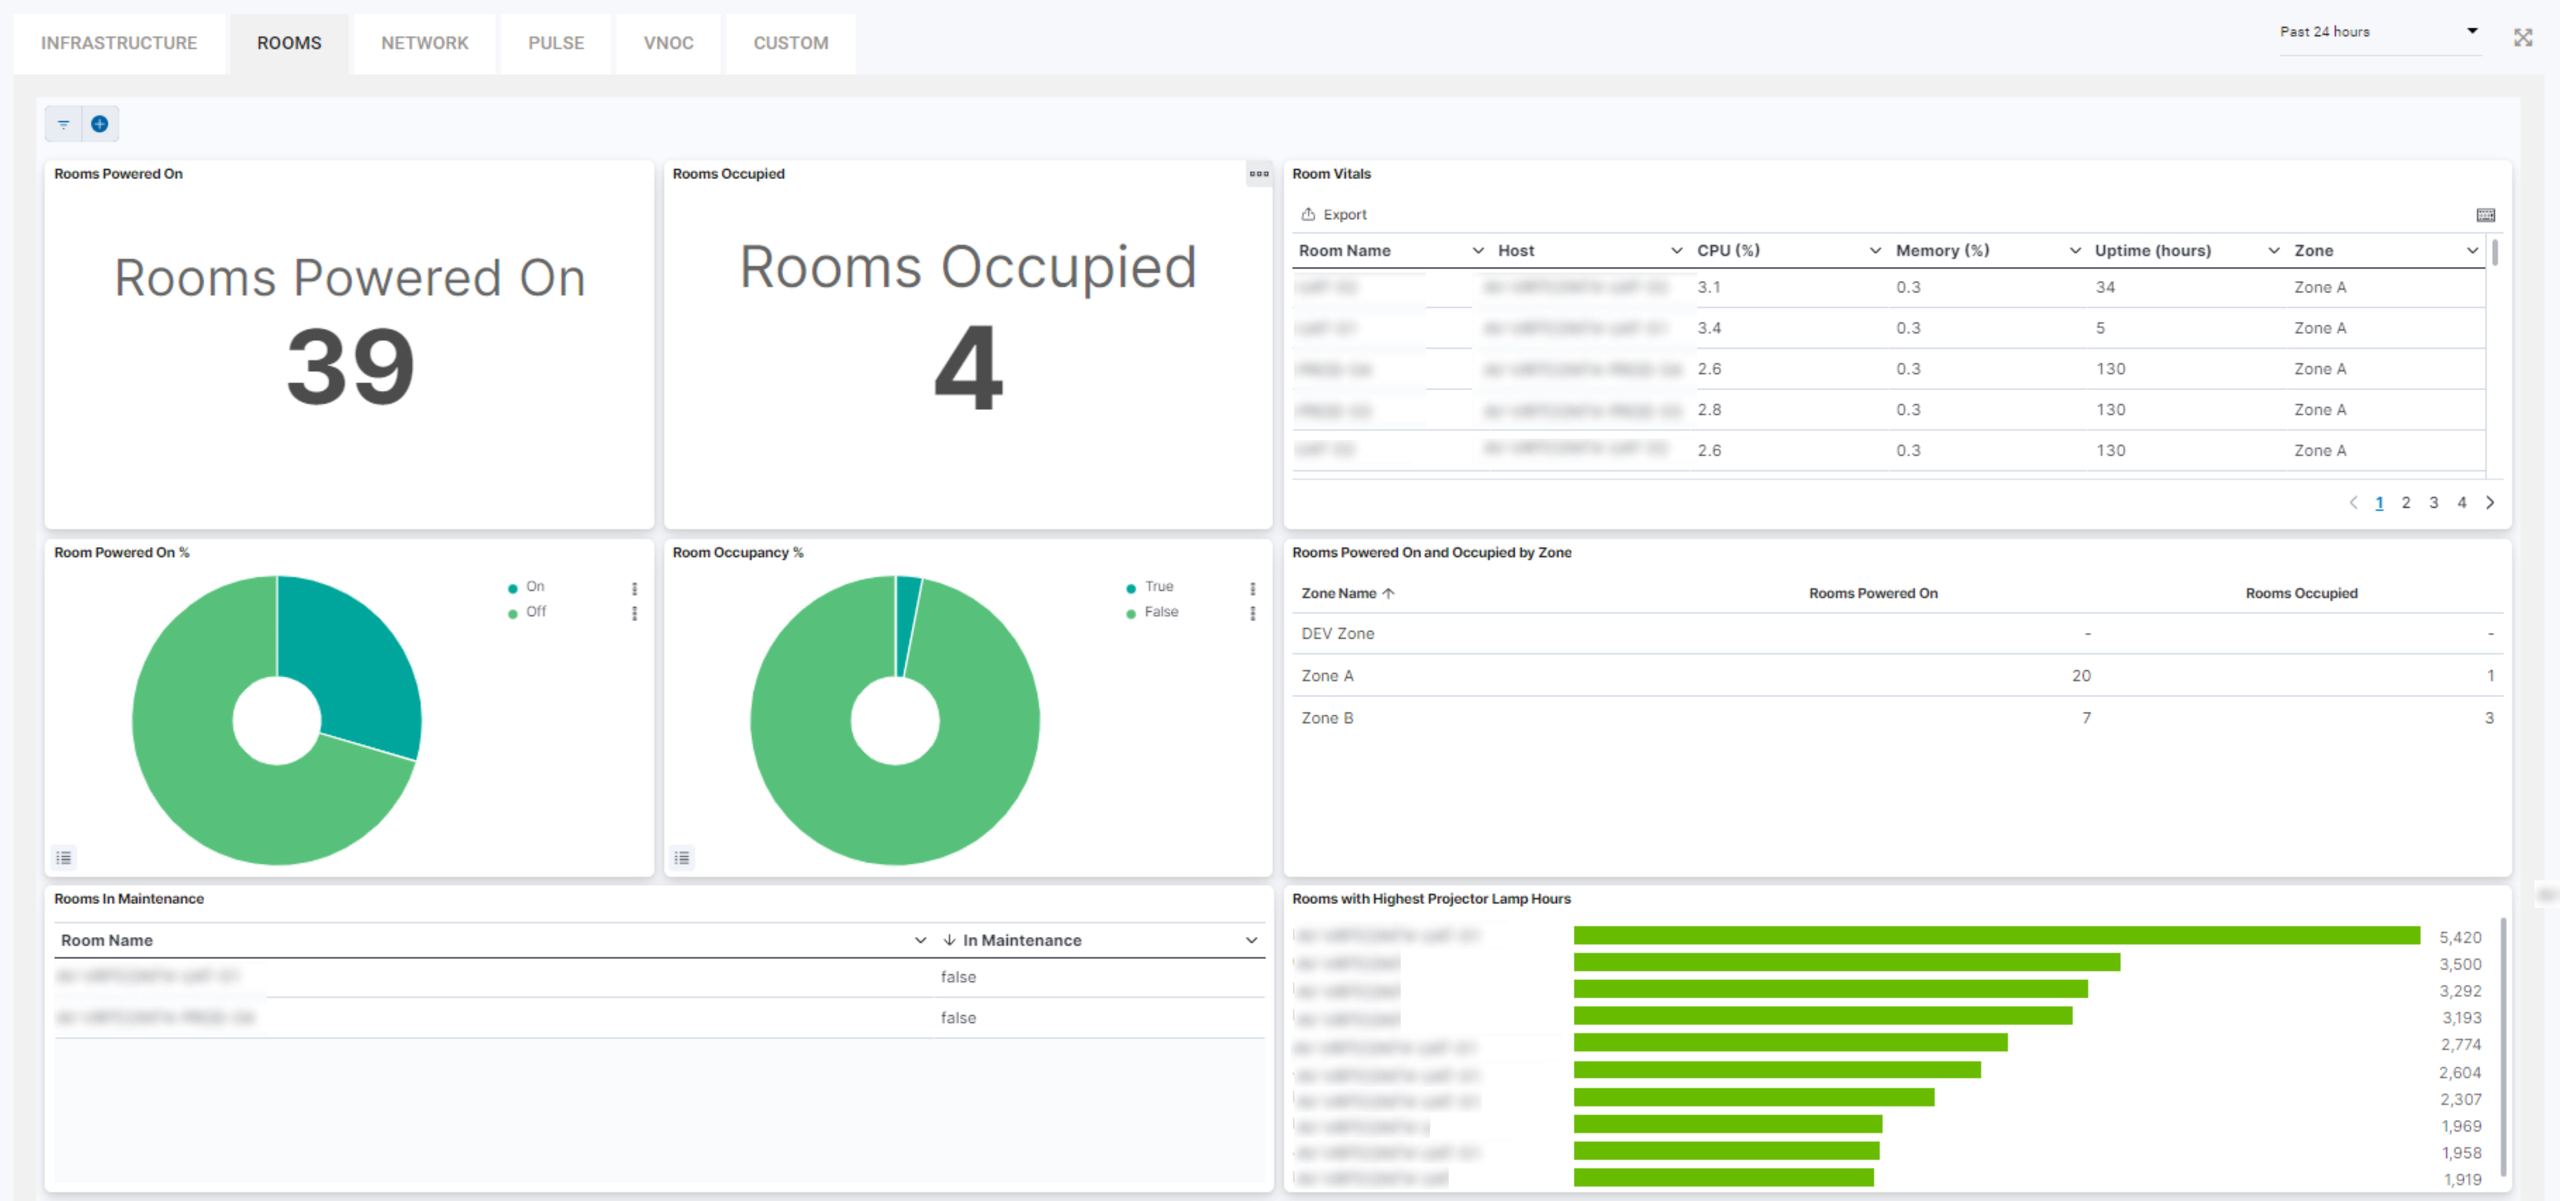
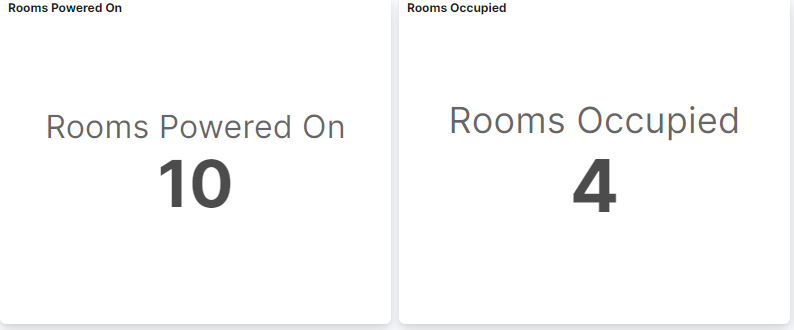
- Rooms Powered On and Rooms Occupied show at-a-glance counts and visual graphs of active rooms.
-
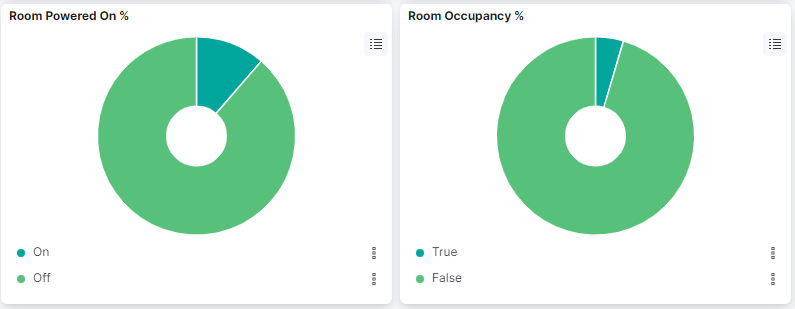
Rooms Powered On (%) and Room Occupancy (%) show the equivalent figures as percentages of the total room fleet.
-
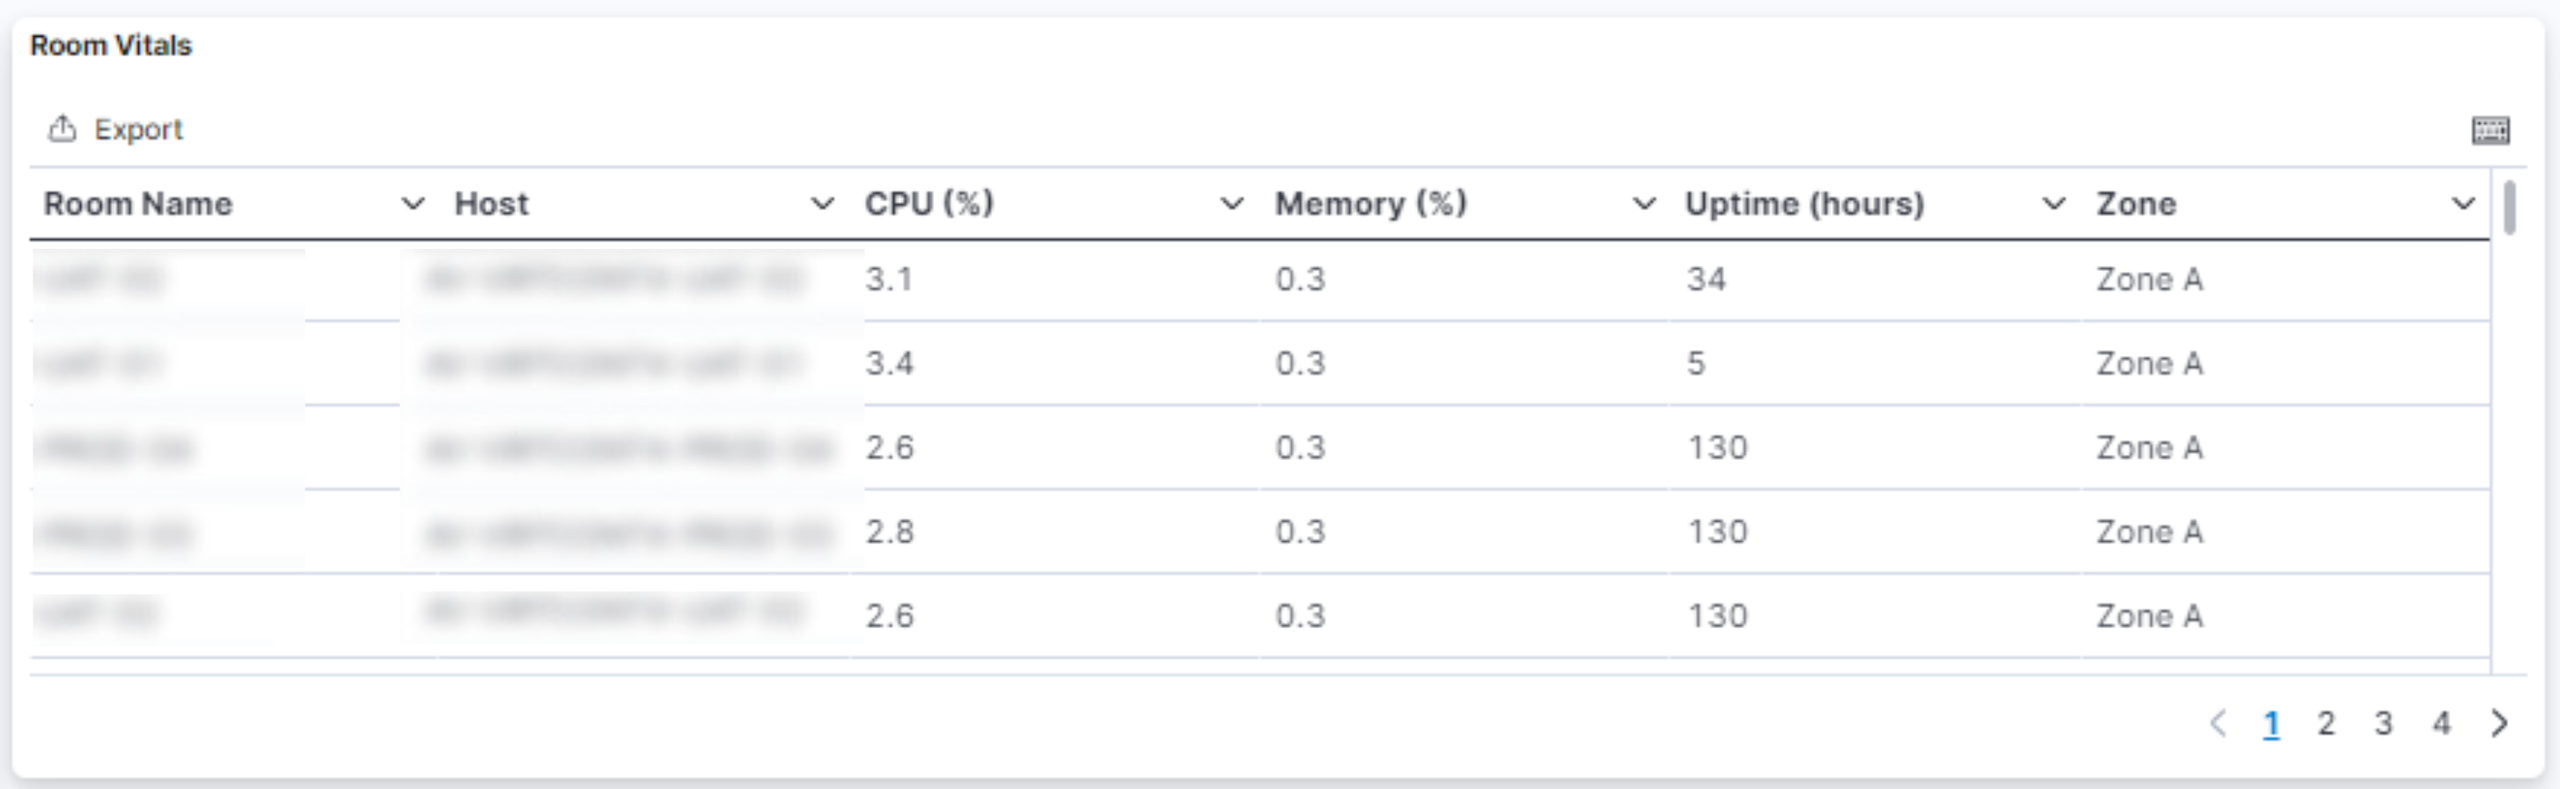
Room Vitals displays detailed usage metrics (CPU%, Memory%), uptime, location, and host data.
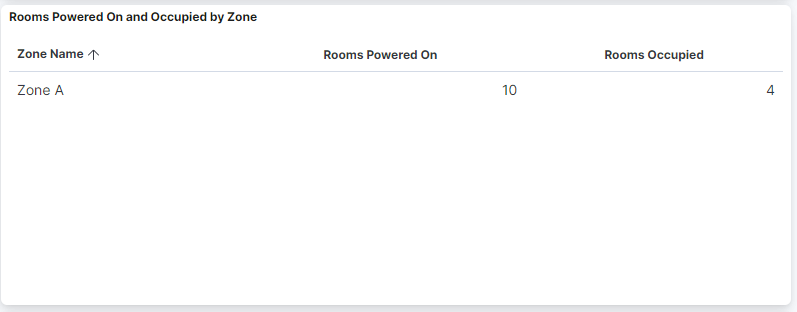
- Rooms Powered On and Occupied by Zone provides a zone-based breakdown of room activity.
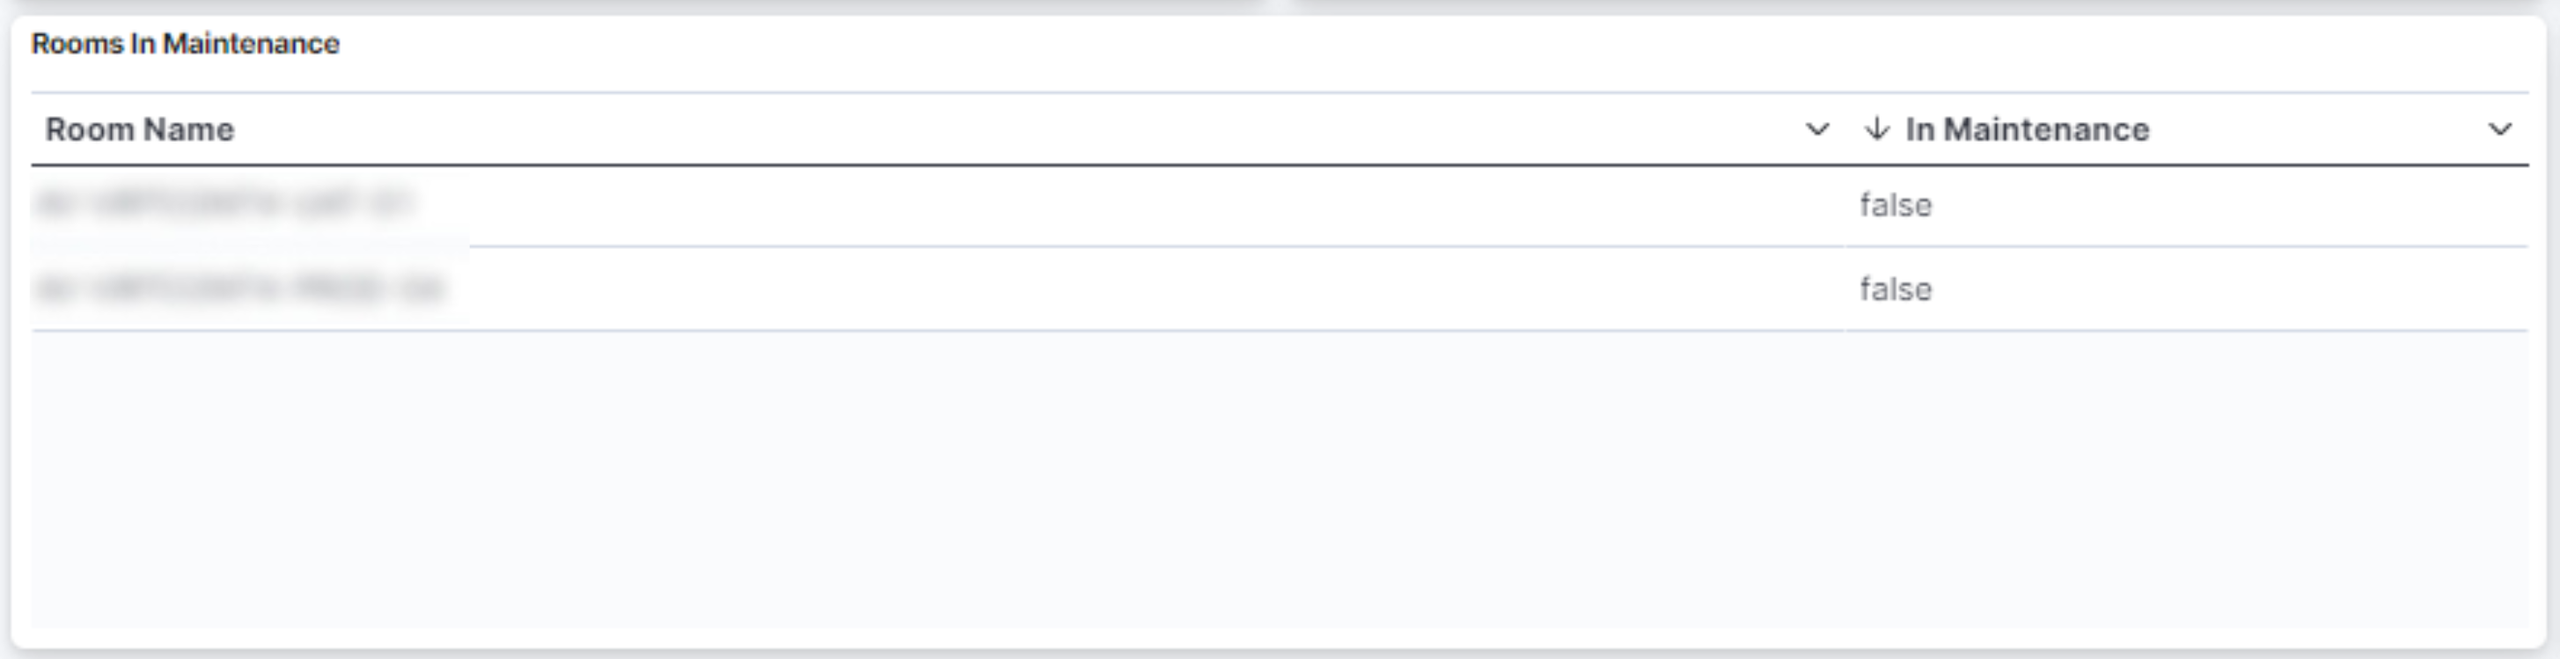
- Rooms In Maintenance lists rooms currently undergoing service.
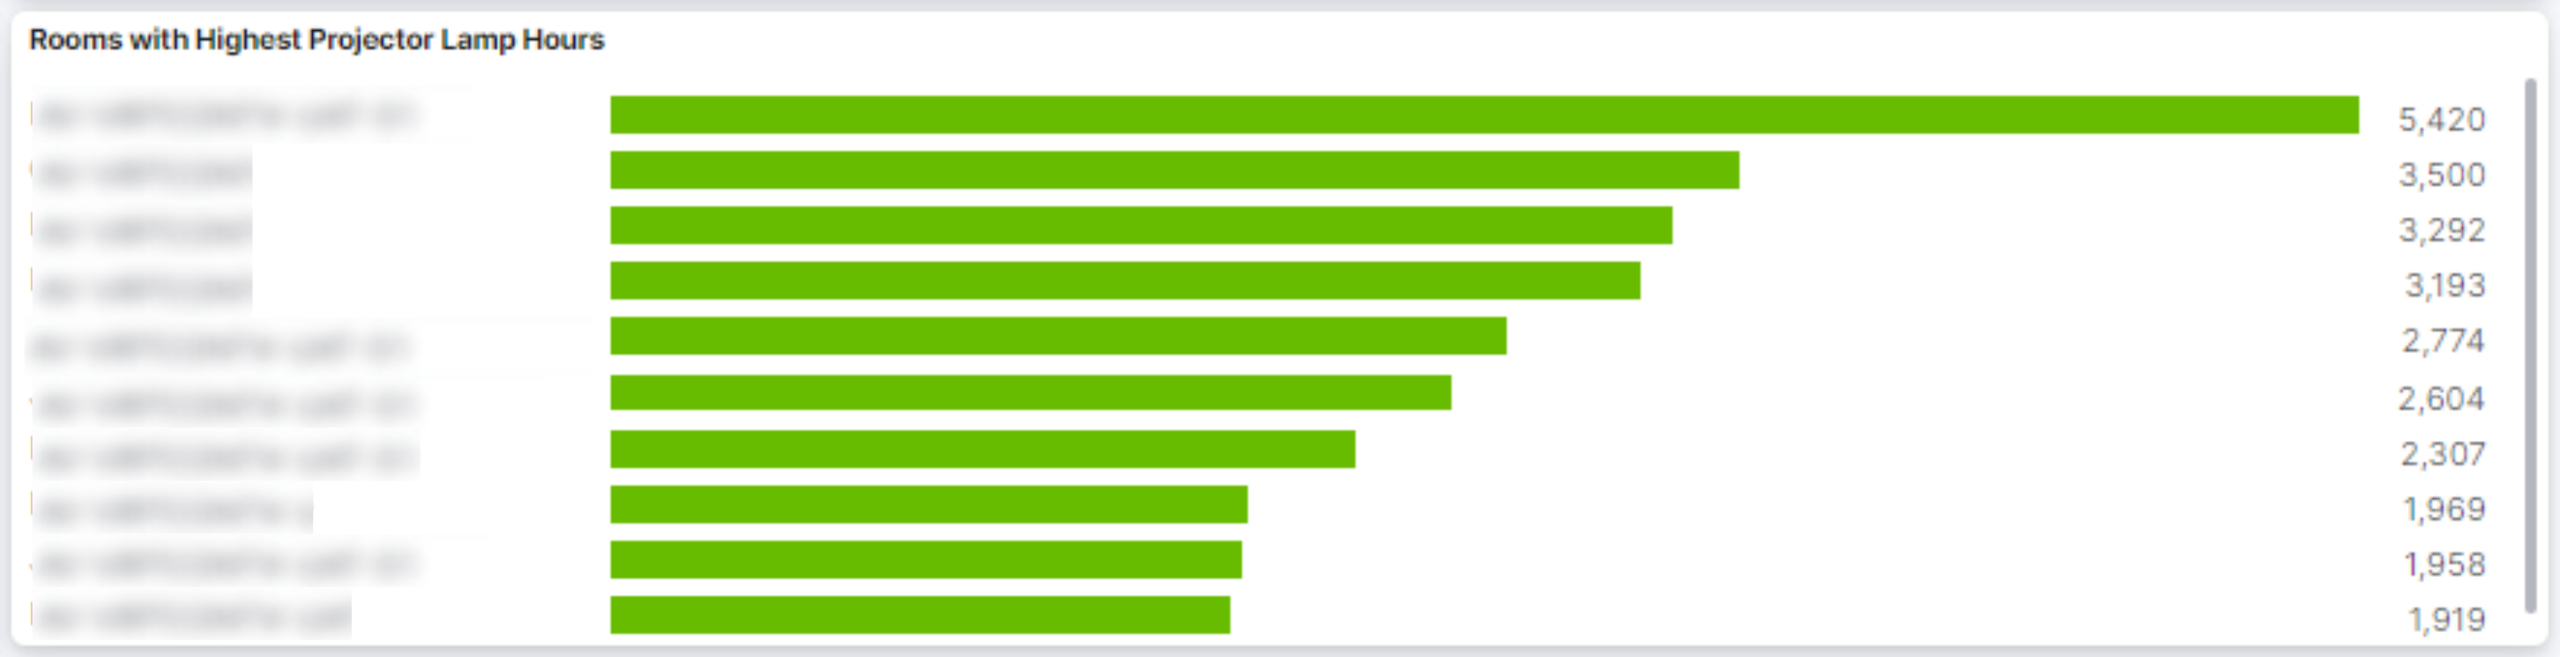
- Top 10 Projector Lamp Hours identifies the most-used projectors by room.
Network
Comprehensive network performance and transaction monitoring:
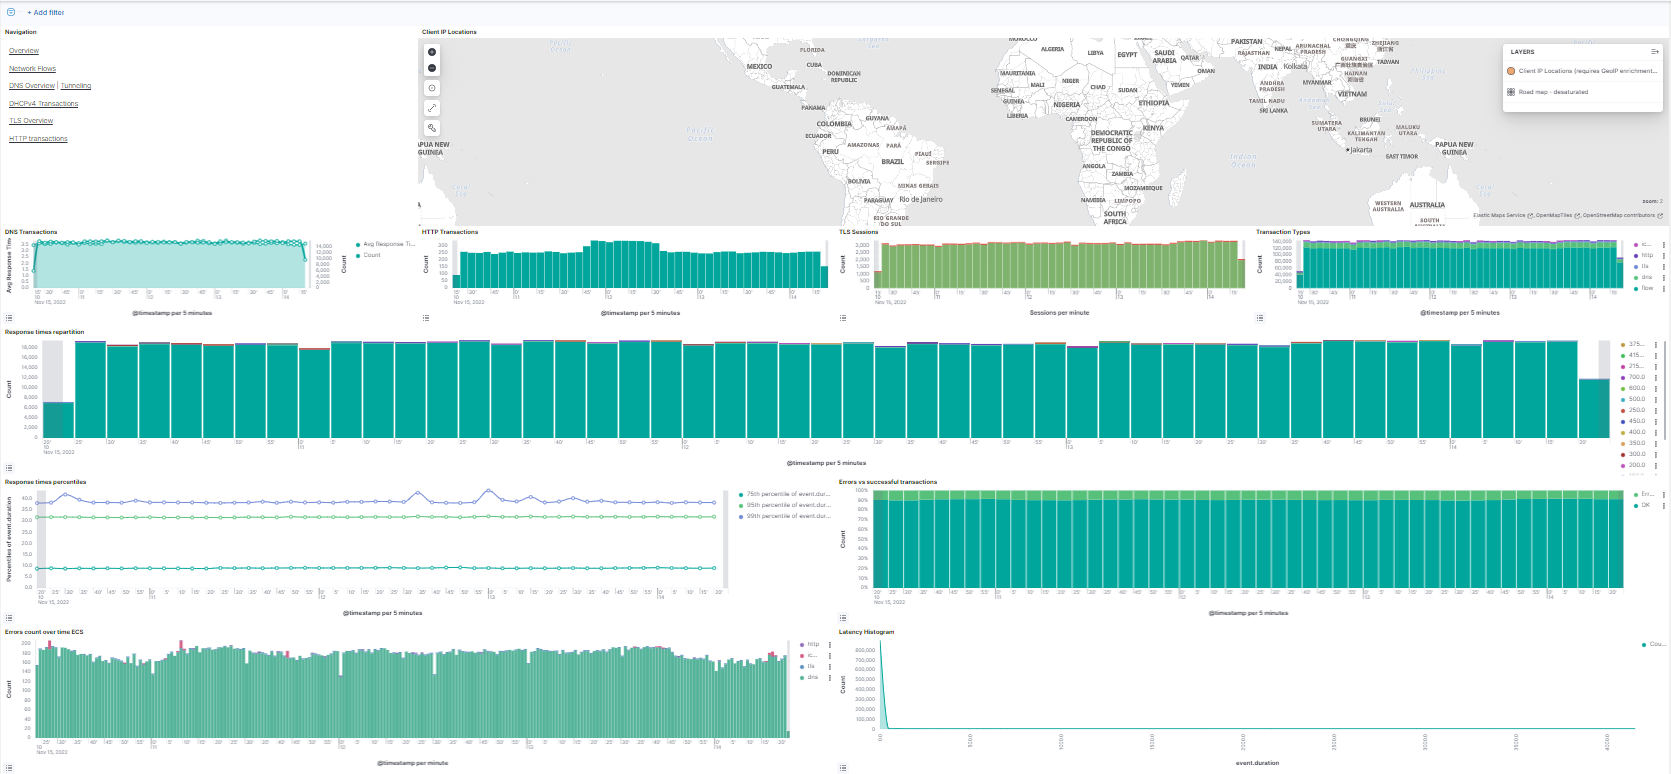
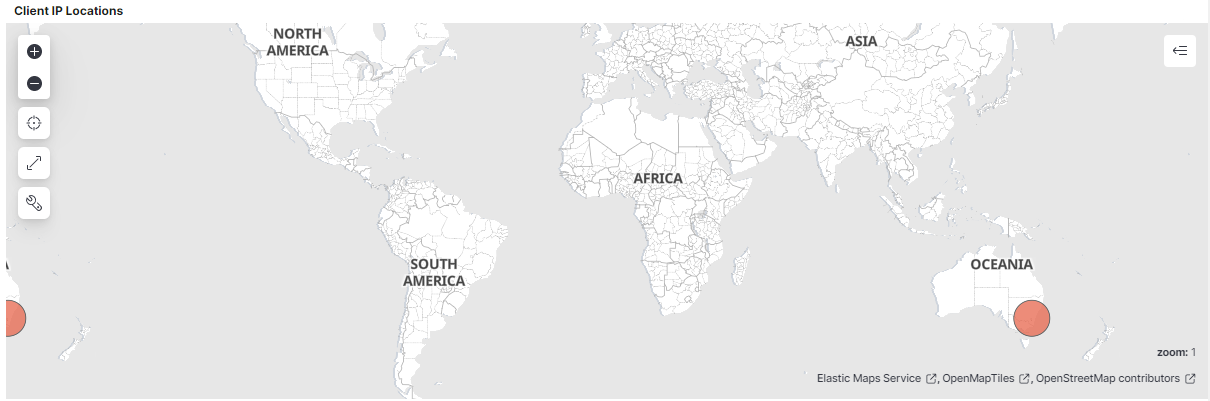
- Client IP Location shows a world map visualisation of connected users.
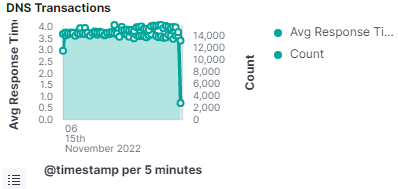
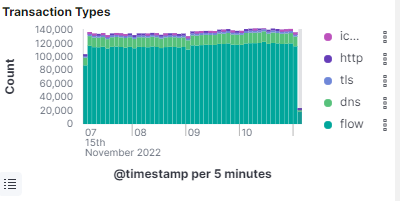
- DNS Transactions tracks hostname resolution frequency.
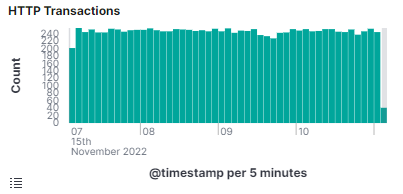
- HTTP Transactions measures server connections every five minutes.
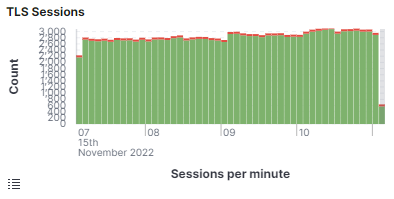
- TLS Sessions shows secure sessions established per minute.
- Transaction Types provides a quantitative breakdown of transaction categories.
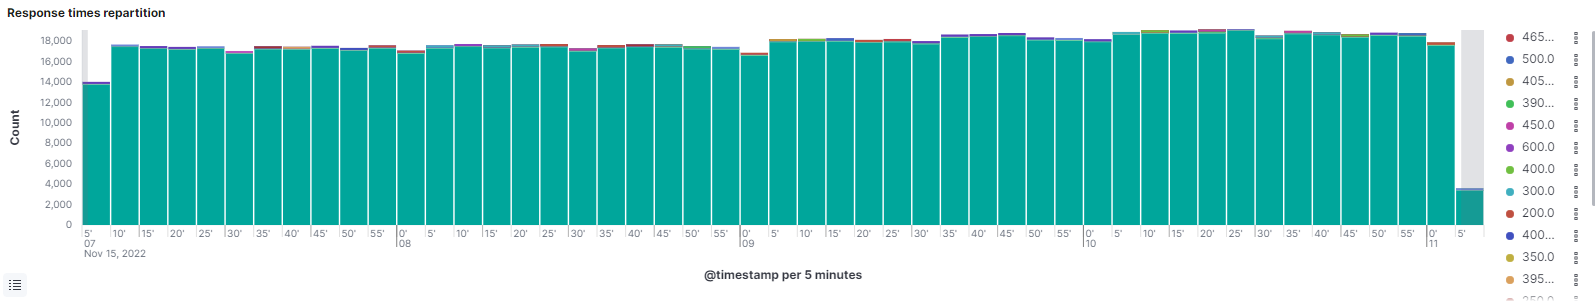
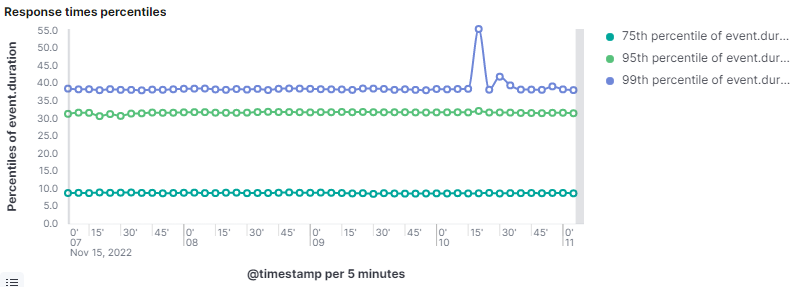
- Response Times displays distribution and percentile analysis.
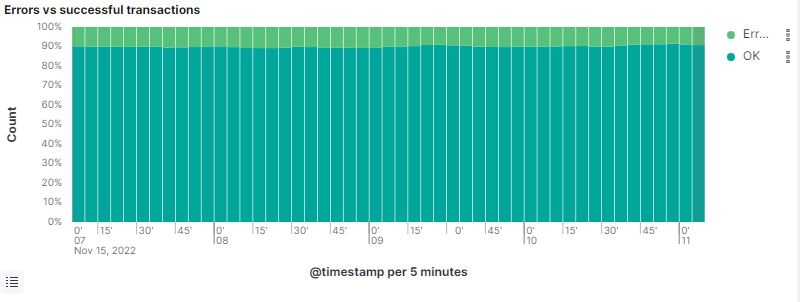
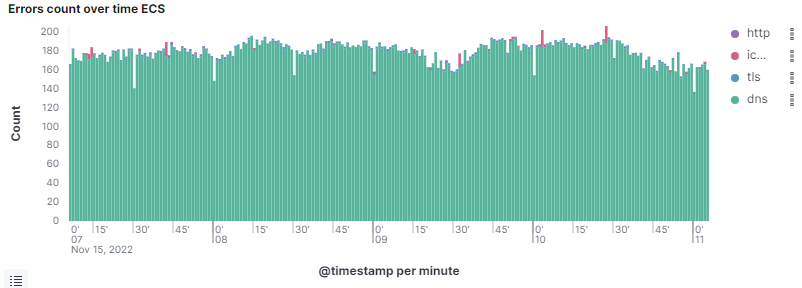
- Errors vs. Successful Transactions provides comparative success and failure metrics.
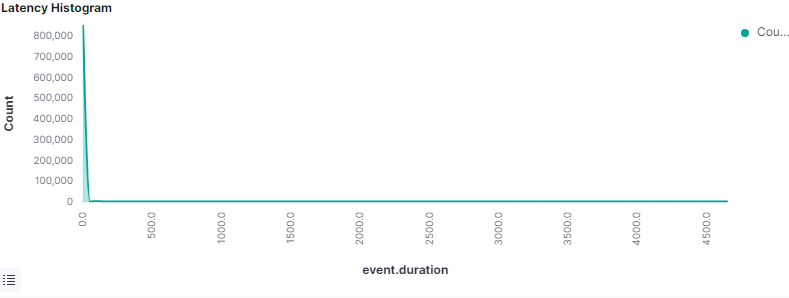
- Latency Histogram visualises request-to-completion time.
Pulse
Device monitoring via the IMTP protocol:
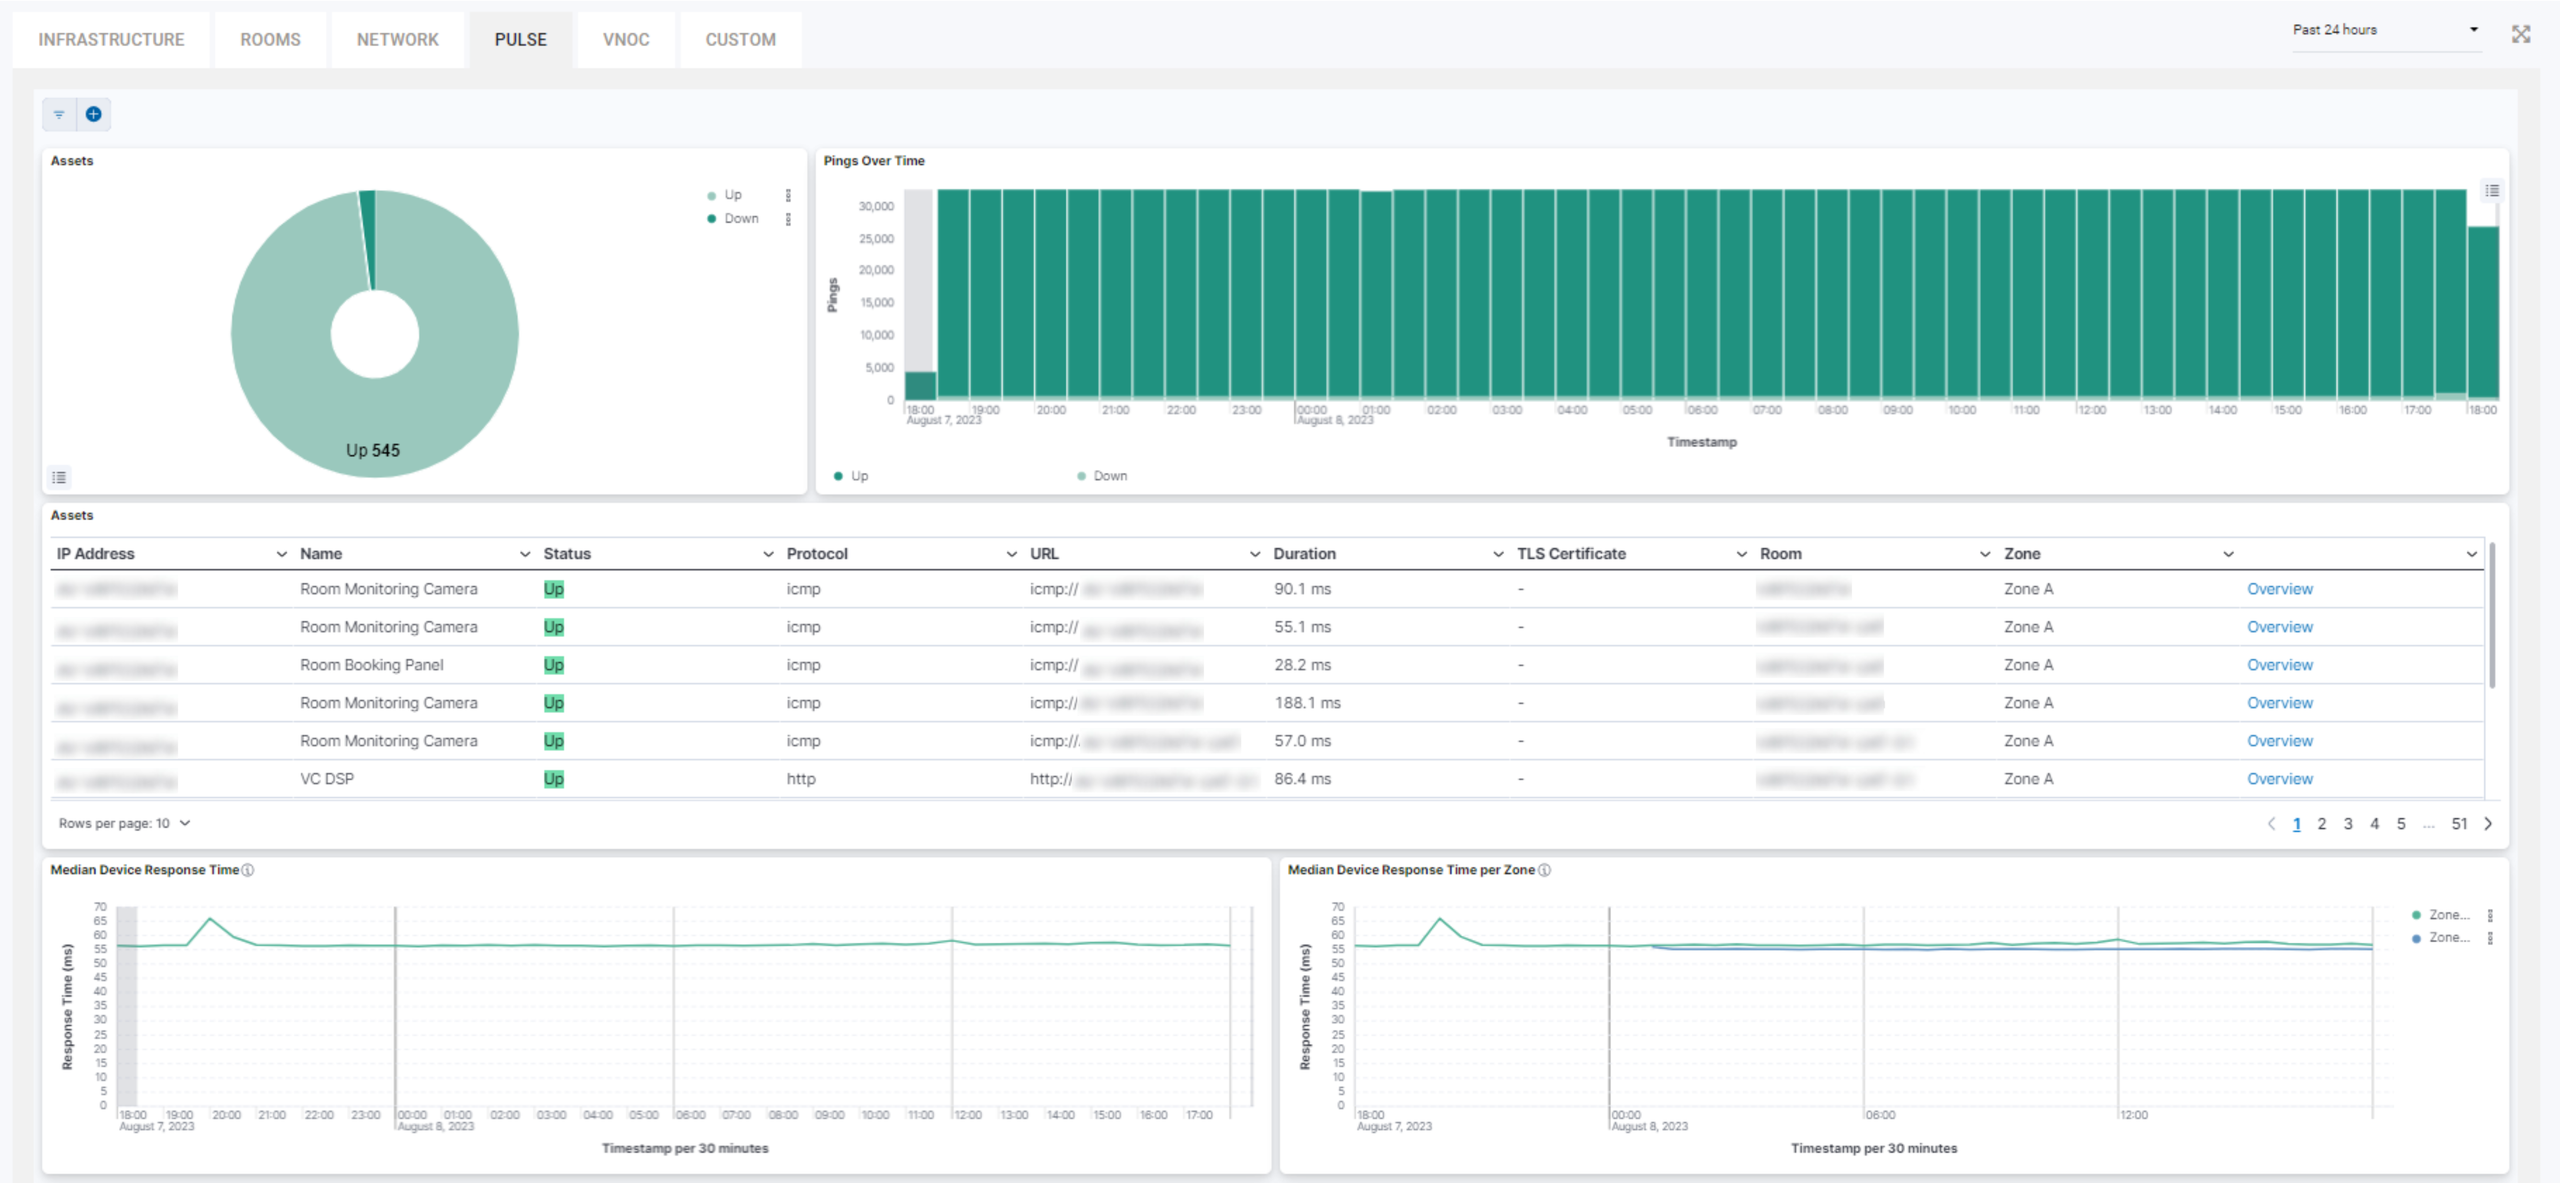
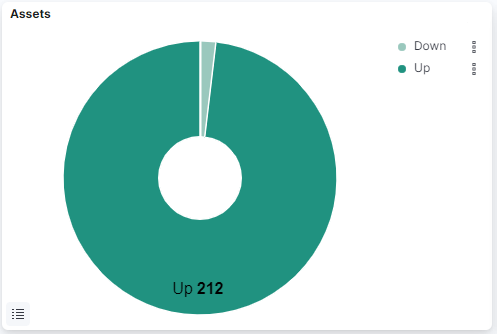
- Assets Up and Down shows a pie chart of online and offline devices.
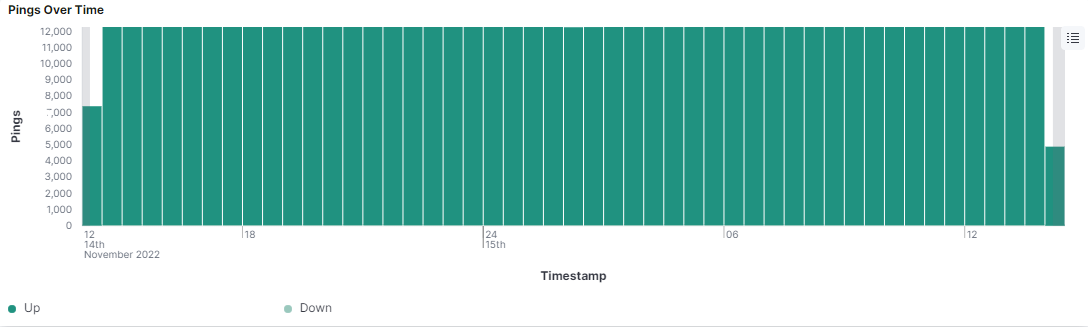
- Pings Over Time tracks Pulse device check frequency.
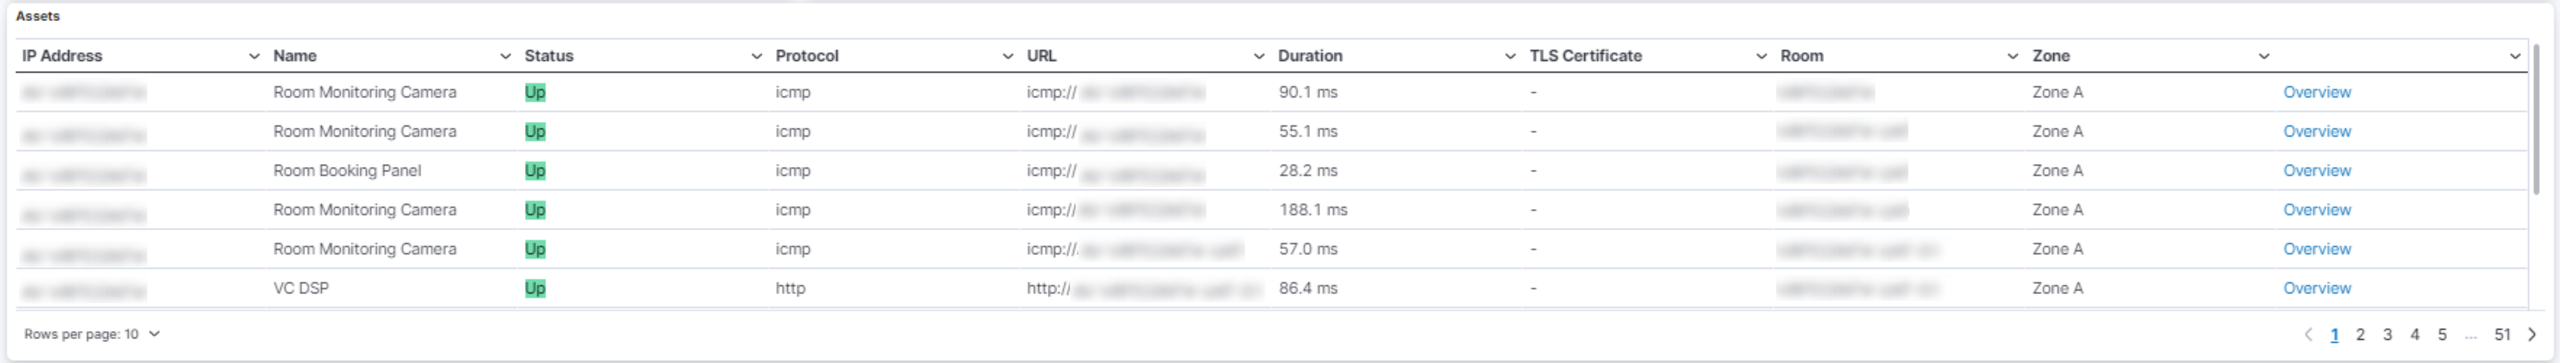
- Assets lists all devices with status, IP address, and location details.
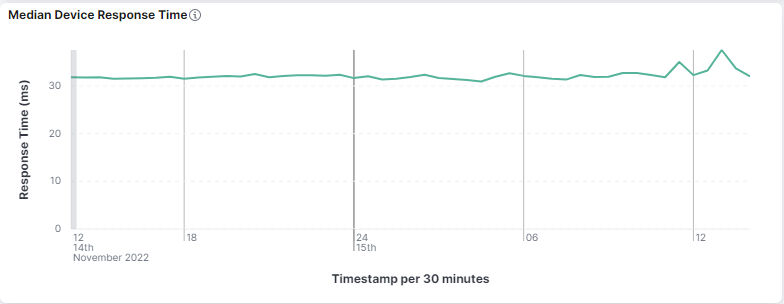
- Median Device Response Time measures device responsiveness in milliseconds.
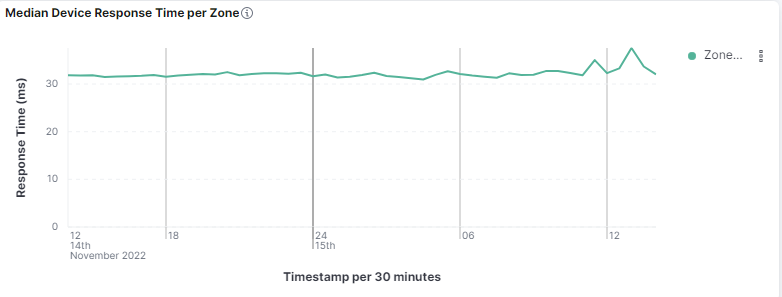
- Median Device Response Time per Zone provides zone-based response metrics.
Sight
Real-time device state monitoring. The Sight tab surfaces expanded information about devices across all rooms.
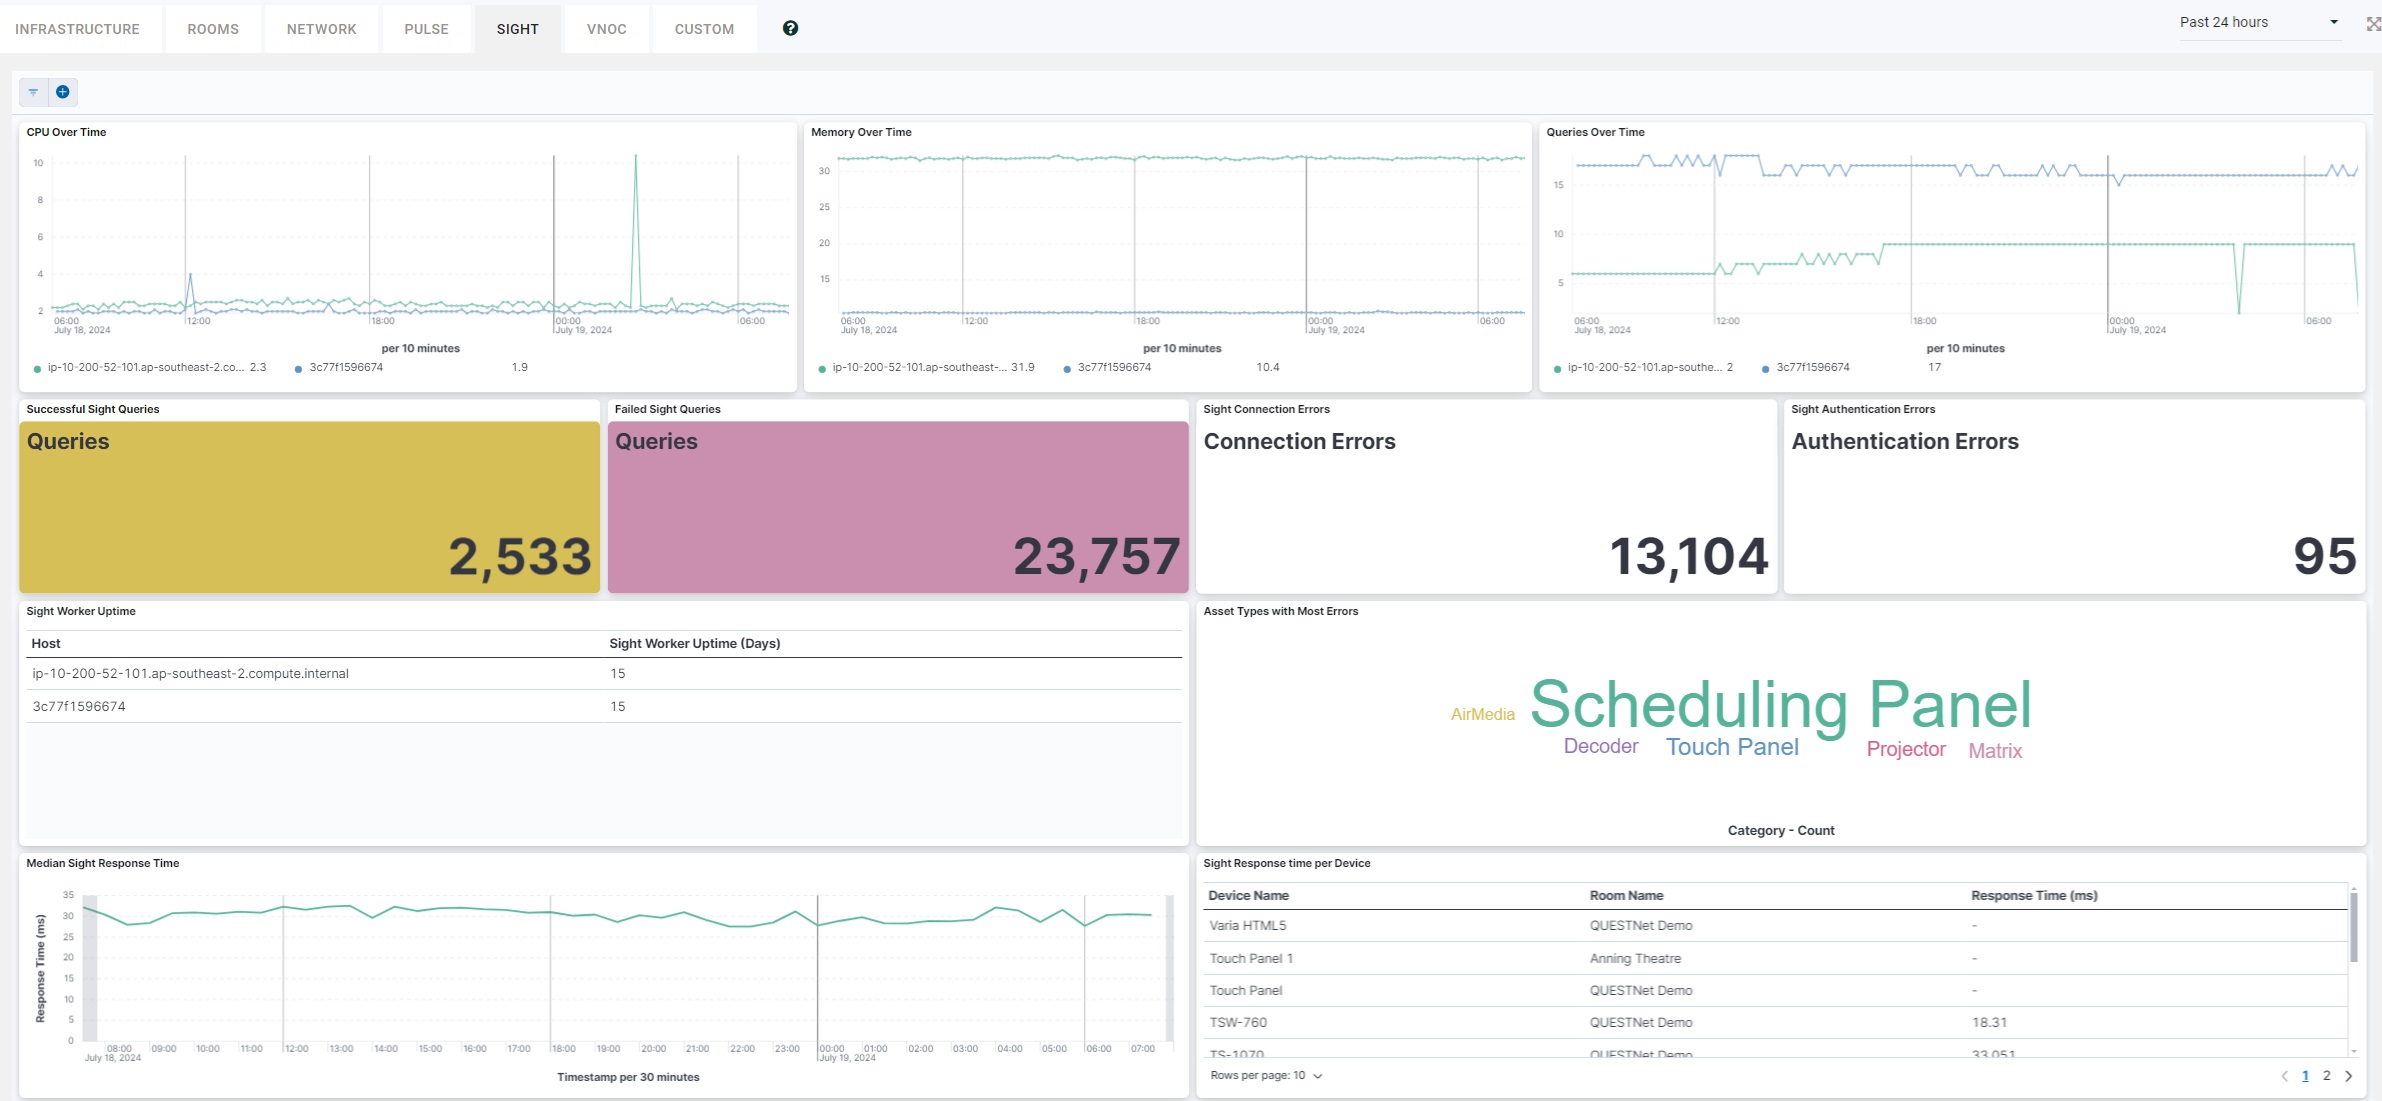
- CPU Over Time — CPU usage of the servers in use.
- Memory Over Time — Memory usage of the servers in use.
- Queries Over Time — Extracted information from the database.
- Successful Sight Queries — Number of successful device pings.
- Failed Sight Queries — Number of unsuccessful device pings.
- Sight Connection Errors — Number of unreachable devices.
- Sight Authentication Errors — Number of Sight authentication errors.
- Sight Worker Uptime — Host uptime in days.
- Asset Types with Most Errors — Device types where most errors have been detected.
- Median Sight Response Time — Average response time.
- Sight Response Time per Device — Response time for reaching a specific device.
VNOC
Visual alerts monitoring for quick insight when issues arise.
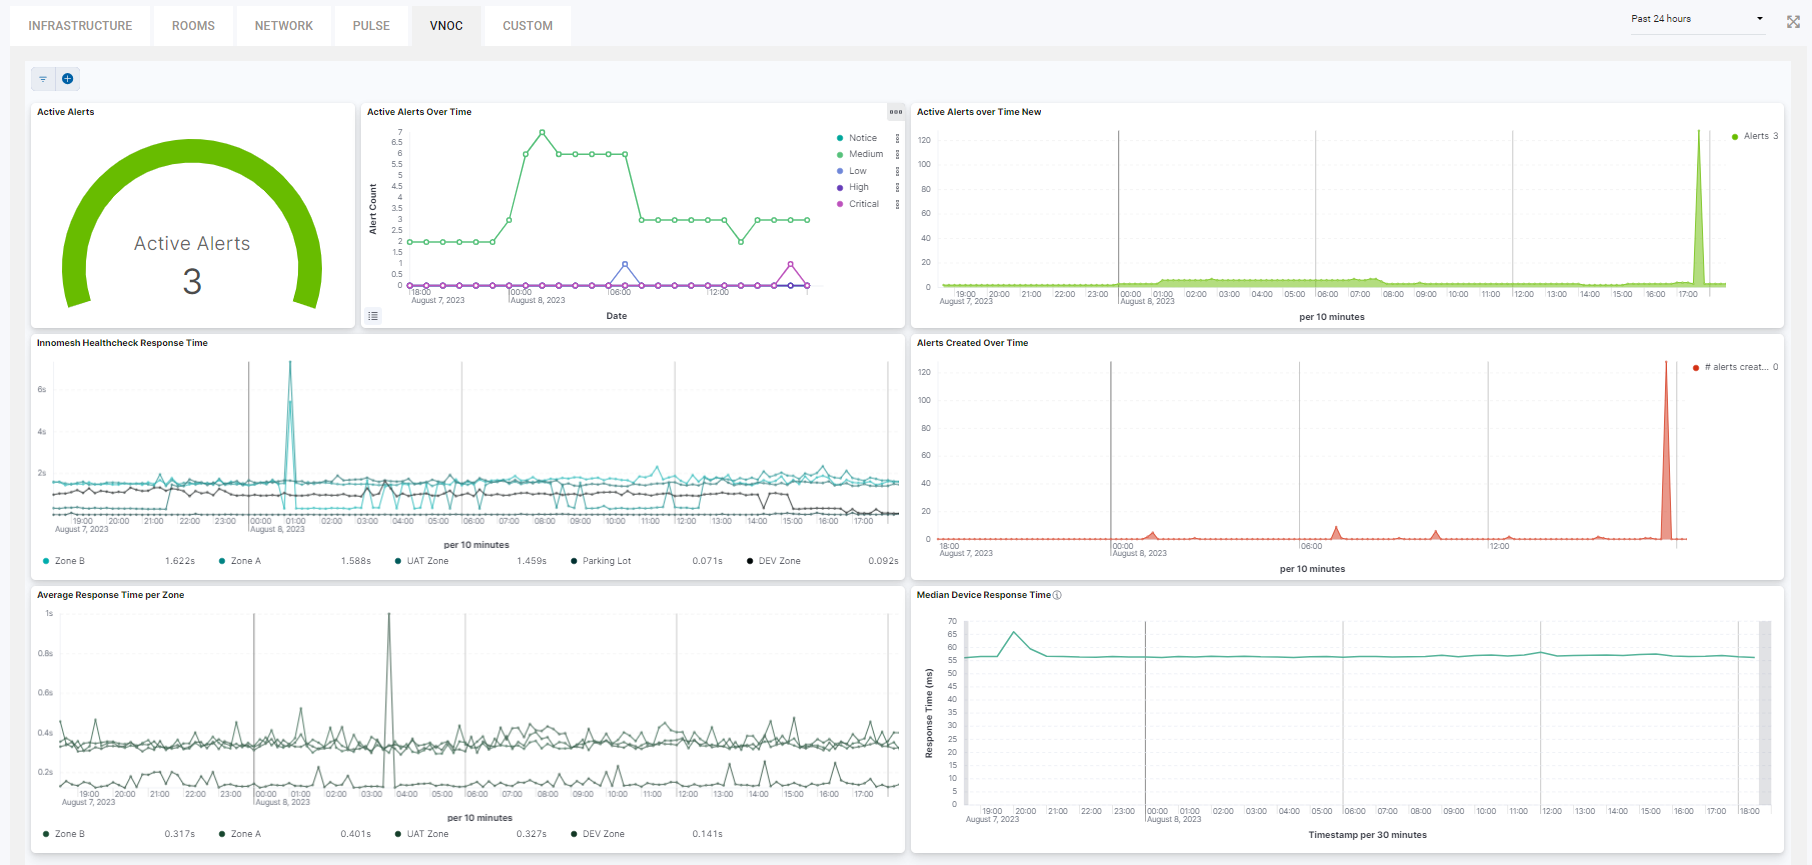
- Active Alerts — Momentary active alerts in the system.
- Active Alerts Over Time — Active alerts across a period of time and date.
- Active Alerts Over Time New — Active alerts per 10-minute time frame.
- Innomesh Healthcheck Response Time — Response time for reaching specific rooms.
- Alerts Created Over Time — Alerts created per 10-minute interval.
- Average Response Time per Zone (TSVB) — Average response time by zone, per 30-minute interval.
- Pulse Device Response Time — Pulse device response time per 10-minute interval.
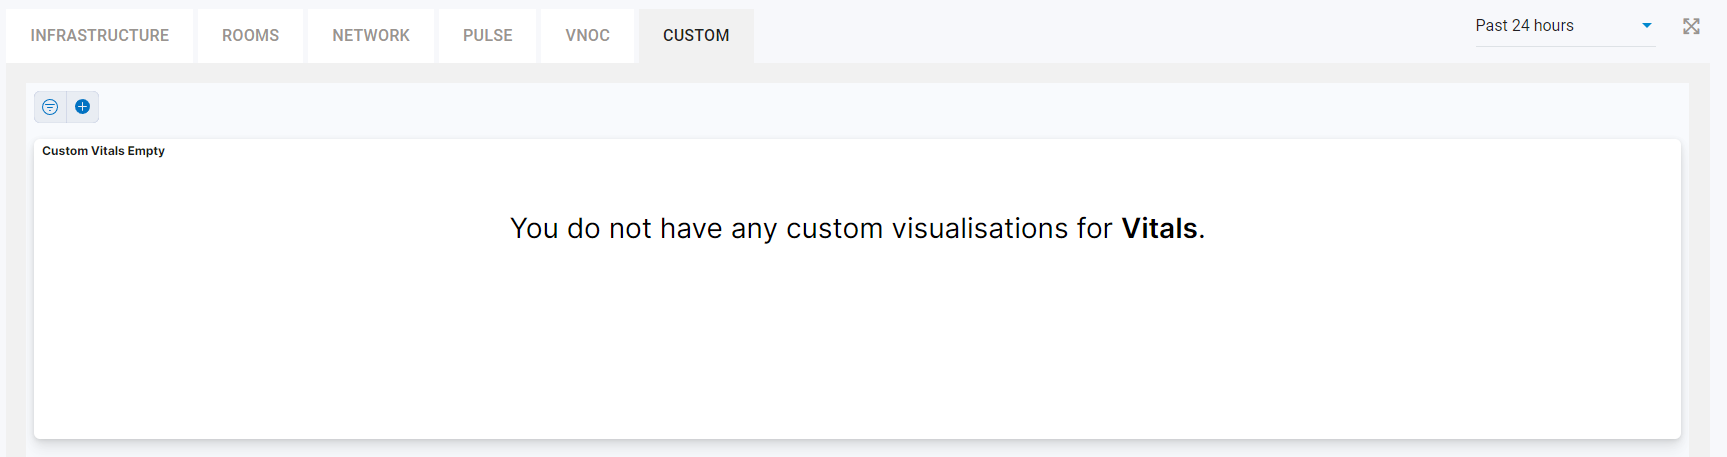
Custom
A configurable dashboard that combines visualisations from other tabs, or entirely new visualisations custom to your tenancy. Setup is tailored per client — reach out to Innomesh with a list of visualisations you’d like populated on your custom tab.