The Innomesh Portal interface is designed around a persistent top navigation bar that provides access to all major sections. This guide covers the structure of the navigation bar, each page it links to, and the key controls available across the Portal.
Navigation Bar
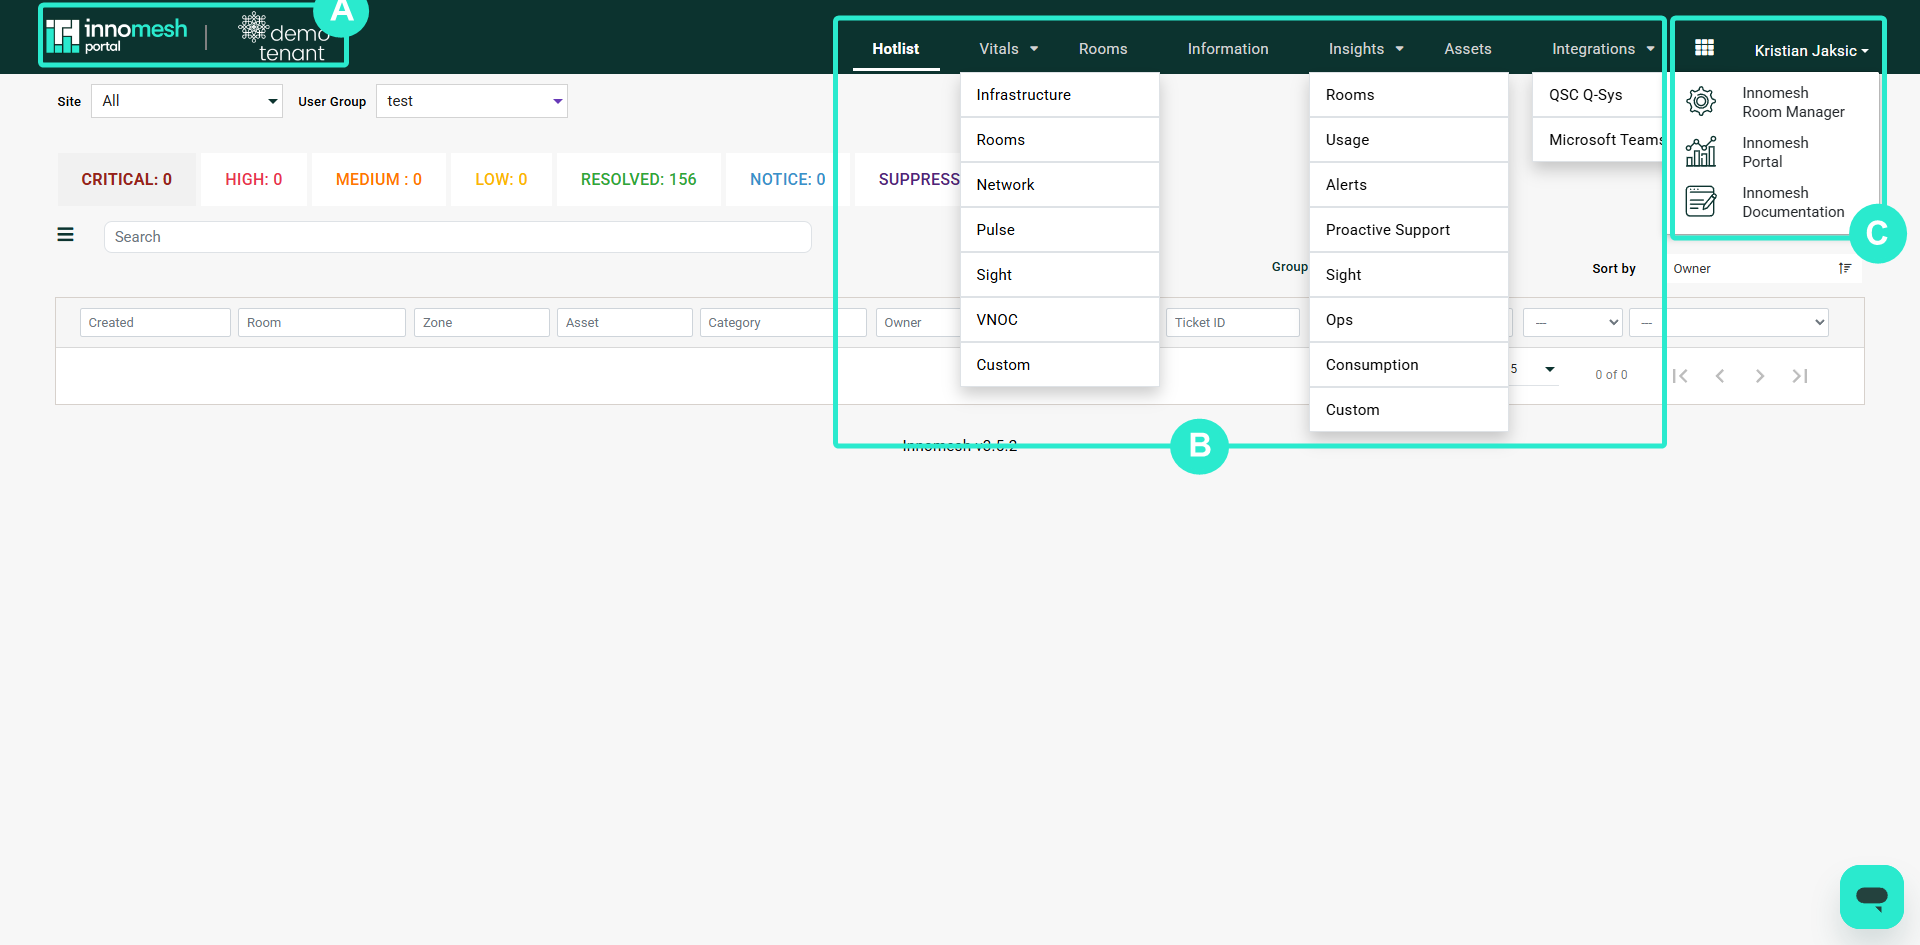
The primary navigation bar runs along the top of the Portal and contains:
- Innomesh and client logos on the left. Click either logo to return to the Hotlist.
- Top navigation links providing access to Hotlist, Vitals, Rooms, Insights, Information (optional), and Assets.
- Platform menu (the nine-dot icon) on the right, which opens a navigator for switching between Room Manager, Portal, and Documentation.
 Navigation bar | Innomesh Portal
Portal Pages
Each top-level link leads to a dedicated page within the Portal.
Hotlist
The Hotlist displays all active alerts organised by severity: Critical, High, Medium, Low, Notice, Resolved, and Suppressed.
Key features include:
- Alarm search for locating specific alerts
- Dashboard view optimised for wide-screen operations displays
- Room grouping to see all alerts for a single location together
- Multi-field sorting across any column
- Alert details including description, creation date, asset name, category, owner, and ticket ID
Vitals
Vitals shows the health of your Innomesh infrastructure, including servers, rooms, and network status.
- Category navigation via a dropdown menu
- Adjustable time periods ranging from 30 minutes to 7 days
- Fullscreen mode for operations displays
- Custom filtering and queries for targeted analysis
- Individual vital controls and API inspection
Rooms
The Rooms page lists every room onboarded into your tenancy.
- Info icon (question mark) providing quick help on the page’s tools, options, and features
- Searchable fields covering room name, ID, zone, power status, type, and alerts
- Rooms powered-on counter showing the number of active rooms
- Multi-field sorting across any column
- Quick navigation to Assets, Insights, and Live Info for any room
- XPanel launch for Crestron touch panels (Space VC rooms)
- Pagination with 15 to 100 rooms per page
Insights
Insights provides usage analytics and business intelligence dashboards.
- Category navigation for switching between dashboard types
- Time period adjustment to control the data window
- Fullscreen mode for presentations and operations displays
- Custom filters and queries for drilling into specific data
- Inspection capabilities for individual graph elements
Assets
The Assets page shows every device in your environment.
- Info icon (question mark) providing quick help on the page’s tools, options, and features
- Filter by applicable actions to narrow the device list (requires Innomesh Ops)
- Multi-field sorting across any column
- Customisable displayed fields to show only the columns you need
- Device details including room, name, category, brand, model, hostname, IP address, IP port, MAC address, serial number, firmware, and middleware
- Device controls available with Innomesh Ops
- CSV download for exporting asset data
- Pagination with 15 to 100 devices per page
Administration and User Controls
Administration
The Administration page (available to admin-role users) lets you enable Change Mode to halt SLA tracking across the entire environment and add custom fields to the Assets page.
Sign Out
Use the Sign Out option in the top-right user menu to log out of the Portal.